## 3D Surface Plot: Paraboloid
### Overview
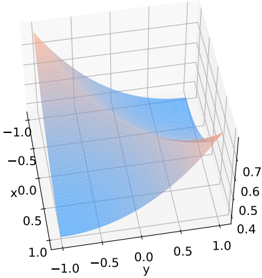
The image is a 3D surface plot, displaying a paraboloid-like surface. The surface is colored with a gradient, transitioning from blue to orange. The plot is rendered with grid lines to enhance visualization.
### Components/Axes
* **X-axis:** Vertical axis labeled "x", ranging from -1.0 to 1.0.
* **Y-axis:** Horizontal axis labeled "y", ranging from -1.0 to 1.0.
* **Z-axis:** Vertical axis on the right side, ranging from 0.4 to 0.7.
### Detailed Analysis
* The surface is curved, with a minimum point in the center.
* The color gradient transitions from blue at the lower values to orange at the higher values.
* The grid lines are present on the surface and the background planes, aiding in depth perception.
### Key Observations
* The surface appears to be a paraboloid, opening upwards.
* The minimum value of the surface is approximately 0.4 on the z-axis.
* The surface rises towards the edges of the plot, reaching a maximum value of approximately 0.7 on the z-axis.
### Interpretation
The 3D surface plot visualizes a function of two variables (x and y), where the z-value represents the output of the function. The paraboloid shape indicates a quadratic relationship between the input variables and the output. The color gradient provides additional information about the magnitude of the output, with blue representing lower values and orange representing higher values. The plot demonstrates how the function's output changes as x and y vary within the specified range.