## 3D Surface Plot: Function f(x, y) Visualization
### Overview
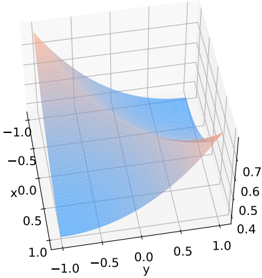
The image depicts a 3D surface plot representing a mathematical function f(x, y). The plot uses a color gradient to indicate z-values, with a blue-to-red gradient overlay on the left side. The axes are labeled with numerical ranges, and the plot includes a legend in the top-left corner. The surface exhibits a smooth, curved structure with varying heights corresponding to x and y values.
---
### Components/Axes
- **X-axis**: Labeled "x" with values ranging from -1.0 (left) to 1.0 (right), marked at intervals of 0.5.
- **Y-axis**: Labeled "y" with values ranging from -1.0 (bottom) to 1.0 (top), marked at intervals of 0.5.
- **Z-axis**: Implicitly represented by the height of the surface, ranging from approximately 0.4 (lowest point) to 0.7 (highest point).
- **Legend**: Located in the top-left corner, but the colors (blue and red) do not match the surface plot's gradient. The legend text is illegible due to low resolution.
- **Surface**: Blue gradient (darker blue at lower z-values, lighter blue at higher z-values) with a red gradient overlay on the left side (x < 0).
---
### Detailed Analysis
1. **Surface Trends**:
- The surface peaks at the top-right corner (x = 1.0, y = 1.0), where z ≈ 0.7.
- The surface dips to its lowest point at the bottom-left corner (x = -1.0, y = -1.0), where z ≈ 0.4.
- A saddle-like structure is visible near the center (x = 0, y = 0), where z ≈ 0.55.
- The red gradient overlay on the left side (x < 0) suggests a secondary variable or threshold, but its relationship to the surface is unclear due to the mismatched legend.
2. **Color Gradient**:
- The blue gradient transitions smoothly from dark blue (z ≈ 0.4) to light blue (z ≈ 0.7).
- The red gradient overlay on the left side (x < 0) appears to highlight a region of interest, but its purpose is ambiguous without a matching legend.
3. **Axis Labels**:
- X-axis: "x" with ticks at -1.0, -0.5, 0.0, 0.5, 1.0.
- Y-axis: "y" with ticks at -1.0, -0.5, 0.0, 0.5, 1.0.
- Z-axis: No explicit label, but inferred from surface height.
---
### Key Observations
- **Inverse Relationship**: As x and y increase from negative to positive, z-values rise, indicating a positive correlation between x/y and z.
- **Red Overlay Ambiguity**: The red gradient on the left side (x < 0) does not align with the blue surface gradient, suggesting either a separate variable or a visualization artifact.
- **Legend Mismatch**: The legend in the top-left corner does not correspond to the colors used in the plot, indicating a potential error or missing context.
---
### Interpretation
The plot visualizes a function f(x, y) where z-values increase with positive x and y, reaching a maximum at (1, 1) and a minimum at (-1, -1). The red gradient overlay on the left side may represent a constraint, threshold, or secondary function, but its purpose is unclear due to the absence of a matching legend. The smooth curvature of the surface suggests a continuous, differentiable function, possibly quadratic or polynomial in nature. The legend's inconsistency highlights a need for clarification in the original visualization to avoid misinterpretation. The plot emphasizes the interplay between x and y in determining z, with the highest values concentrated in the positive quadrant.