## Line Chart with Error Bands: Mistral-7B Model Layer-wise "I-Don't-Know" Rate Analysis
### Overview
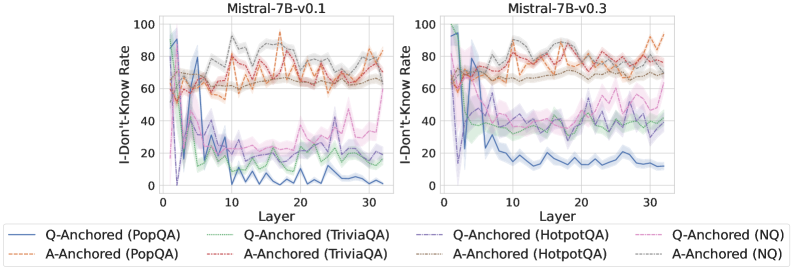
The image displays two side-by-side line charts comparing the "I-Don't-Know Rate" across the layers of two versions of the Mistral-7B language model: v0.1 (left) and v0.3 (right). Each chart plots eight data series, representing two anchoring methods (Q-Anchored and A-Anchored) evaluated on four different question-answering datasets (PopQA, TriviaQA, HotpotQA, NQ). The lines show the rate trend across model layers (0 to 32), with shaded regions indicating uncertainty or variance.
### Components/Axes
* **Chart Titles:**
* Left Chart: `Mistral-7B-v0.1`
* Right Chart: `Mistral-7B-v0.3`
* **Y-Axis (Both Charts):** Label: `I-Don't-Know Rate`. Scale: 0 to 100, with major ticks at 0, 20, 40, 60, 80, 100.
* **X-Axis (Both Charts):** Label: `Layer`. Scale: 0 to 32, with major ticks at 0, 10, 20, 30.
* **Legend (Bottom, spanning both charts):** Contains 8 entries, differentiating lines by color and style (solid for Q-Anchored, dashed for A-Anchored).
* `Q-Anchored (PopQA)`: Solid blue line
* `A-Anchored (PopQA)`: Dashed orange line
* `Q-Anchored (TriviaQA)`: Solid green line
* `A-Anchored (TriviaQA)`: Dashed red line
* `Q-Anchored (HotpotQA)`: Solid purple line
* `A-Anchored (HotpotQA)`: Dashed brown line
* `Q-Anchored (NQ)`: Solid pink line
* `A-Anchored (NQ)`: Dashed gray line
### Detailed Analysis
**Chart 1: Mistral-7B-v0.1**
* **Q-Anchored Series (Solid Lines):** All four series show a similar, dramatic trend. They start at a very high "I-Don't-Know Rate" (approximately 80-100) at Layer 0. There is a sharp, precipitous drop within the first 5-7 layers, falling to rates between ~10 and ~40. After this initial drop, the rates fluctuate with moderate volatility across the remaining layers (10-32). The blue line (PopQA) ends the lowest, near 0-10. The pink line (NQ) ends the highest among this group, near 40-50.
* **A-Anchored Series (Dashed Lines):** These series exhibit a markedly different pattern. They start at a moderate rate (approximately 50-70) at Layer 0. They show a slight initial increase or stability in the early layers, followed by a general, gradual upward trend with fluctuations. By Layer 32, all A-Anchored series converge in a high range, approximately between 70 and 90. The orange line (PopQA) and red line (TriviaQA) appear to be among the highest at the final layer.
**Chart 2: Mistral-7B-v0.3**
* **Q-Anchored Series (Solid Lines):** The pattern is broadly similar to v0.1 but with notable differences in magnitude. The initial drop from Layer 0 is still present but appears less severe for some datasets. The post-drop fluctuation occurs at a generally higher baseline. For example, the blue line (PopQA) stabilizes around 10-20 instead of near 0. The pink line (NQ) fluctuates between 40-60.
* **A-Anchored Series (Dashed Lines):** These series also start in the 50-70 range and trend upward. The final values at Layer 32 appear slightly higher and more tightly clustered than in v0.1, mostly between 75 and 95. The separation between the A-Anchored cluster and the Q-Anchored cluster is more pronounced in the later layers compared to v0.1.
### Key Observations
1. **Fundamental Dichotomy:** There is a clear and consistent separation in behavior between Q-Anchored and A-Anchored evaluation methods across both model versions. Q-Anchored rates drop sharply early on, while A-Anchored rates trend upward gradually.
2. **Layer Sensitivity:** The model's tendency to output "I don't know" is highly sensitive to the specific layer being probed, especially in the first quarter of the network (Layers 0-8).
3. **Model Version Difference:** Mistral-7B-v0.3 shows a general increase in the "I-Don't-Know Rate" for both anchoring methods compared to v0.1, particularly in the middle and later layers. The Q-Anchored rates in v0.3 do not fall as low as in v0.1.
4. **Dataset Variation:** While the overall trend is consistent per anchoring method, the specific rate values differ by dataset. For instance, NQ (pink/gray) consistently shows higher Q-Anchored rates than PopQA (blue/orange) in the later layers of both models.
### Interpretation
This data suggests a fundamental difference in what the Q-Anchored and A-Anchored probing methods measure within the Mistral-7B model's internal representations.
* **Q-Anchored (Question-Anchored)** probing likely measures the model's *confidence in generating an answer* given the question context. The sharp early drop indicates that by the early-to-mid layers, the model has already committed to generating *some* answer token (whether correct or not), drastically reducing its propensity to explicitly state uncertainty. The low final rates suggest the model rarely defaults to "I don't know" when conditioned on the question alone in its later processing stages.
* **A-Anchored (Answer-Anchored)** probing likely measures the model's *ability to recognize or validate a given answer*. The gradual upward trend suggests that as information propagates through deeper layers, the model becomes *more likely* to reject a provided answer as incorrect or unsupported, hence increasing the "I-Don't-Know" rate. This reflects a growing critical evaluation mechanism.
The increase in rates from v0.1 to v0.3 could indicate a shift in the model's training or alignment, making it either more cautious (higher A-Anchored rejection) or less confident in its initial recall (higher Q-Anchored uncertainty). The charts reveal that a model's "uncertainty" is not a single value but a dynamic property that depends heavily on *how* and *where* within its architecture it is measured.