## Line Chart: I-Don't-Know Rate Across Layers in Mistral-7B Models
### Overview
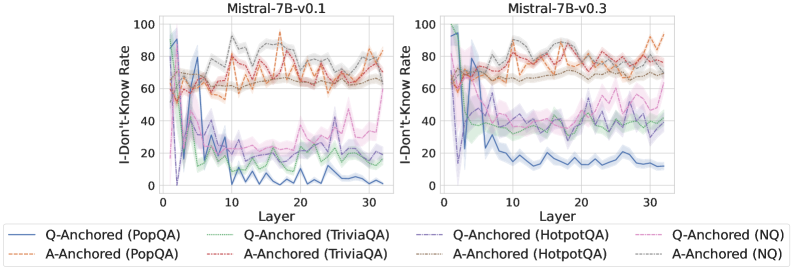
The image contains two side-by-side line charts comparing the "I-Don't-Know Rate" (y-axis) across 30 layers (x-axis) for two versions of the Mistral-7B model (v0.1 and v0.3). Each chart includes six data series differentiated by line styles and colors, representing various anchoring methods and datasets (PopQA, TriviaQA, HotpotQA, NQ).
### Components/Axes
- **X-axis**: Layer (0–30, integer ticks)
- **Y-axis**: I-Don't-Know Rate (%) (0–100, integer ticks)
- **Legends**:
- **Left Chart (v0.1)**:
- Solid blue: Q-Anchored (PopQA)
- Dashed orange: A-Anchored (PopQA)
- Dotted green: Q-Anchored (TriviaQA)
- Dash-dot red: A-Anchored (TriviaQA)
- Dash-dot-dot purple: Q-Anchored (HotpotQA)
- Dotted gray: A-Anchored (HotpotQA)
- **Right Chart (v0.3)**:
- Solid blue: Q-Anchored (PopQA)
- Dashed orange: A-Anchored (PopQA)
- Dotted green: Q-Anchored (TriviaQA)
- Dash-dot red: A-Anchored (TriviaQA)
- Dash-dot-dot purple: Q-Anchored (NQ)
- Dotted gray: A-Anchored (NQ)
### Detailed Analysis
#### Left Chart (Mistral-7B-v0.1)
- **Q-Anchored (PopQA)**: Starts at ~85%, dips to ~20% at layer 10, then fluctuates between 30–60%.
- **A-Anchored (PopQA)**: Peaks at ~90% at layer 0, stabilizes around 60–80% with minor oscillations.
- **Q-Anchored (TriviaQA)**: Begins at ~70%, drops to ~10% at layer 10, then rises to ~50% by layer 30.
- **A-Anchored (TriviaQA)**: Starts at ~60%, fluctuates between 40–80%.
- **Q-Anchored (HotpotQA)**: Peaks at ~95% at layer 0, drops to ~30% at layer 10, then stabilizes at ~50–70%.
- **A-Anchored (HotpotQA)**: Starts at ~70%, fluctuates between 50–90%.
#### Right Chart (Mistral-7B-v0.3)
- **Q-Anchored (PopQA)**: Starts at ~70%, dips to ~20% at layer 10, then stabilizes at ~40–60%.
- **A-Anchored (PopQA)**: Peaks at ~80% at layer 0, stabilizes around 60–80%.
- **Q-Anchored (TriviaQA)**: Begins at ~60%, drops to ~10% at layer 10, then rises to ~40% by layer 30.
- **A-Anchored (TriviaQA)**: Starts at ~50%, fluctuates between 30–70%.
- **Q-Anchored (NQ)**: Peaks at ~90% at layer 0, drops to ~20% at layer 10, then stabilizes at ~40–60%.
- **A-Anchored (NQ)**: Starts at ~60%, fluctuates between 40–80%.
### Key Observations
1. **Version Differences**:
- v0.3 shows generally lower I-Don't-Know rates than v0.1 for most models (e.g., Q-Anchored PopQA drops from ~85% to ~70% at layer 0).
- v0.3 exhibits smoother trends compared to v0.1’s sharper fluctuations.
2. **Anchoring Impact**:
- Q-Anchored models consistently show lower rates than A-Anchored counterparts in both versions.
- Exceptions: A-Anchored (HotpotQA) in v0.1 briefly exceeds Q-Anchored (HotpotQA) at layer 5.
3. **Dataset Variability**:
- HotpotQA and NQ datasets exhibit the highest variability (e.g., Q-Anchored NQ in v0.3 peaks at ~90% at layer 0).
- PopQA and TriviaQA datasets show more stable trends.
### Interpretation
The data suggests that anchoring methods (Q vs. A) significantly influence the I-Don't-Know Rate, with Q-Anchored models generally performing better. Version v0.3 demonstrates improved stability across datasets, likely due to architectural refinements. However, the HotpotQA and NQ datasets remain outliers, indicating potential challenges in handling complex queries. The layer-specific fluctuations (e.g., sharp drops at layer 10) may reflect model architecture design choices, such as attention mechanisms or layer normalization. Further investigation into dataset-specific model behavior is warranted.