## Line Chart: Performance Metrics Across Models and Token Counts
### Overview
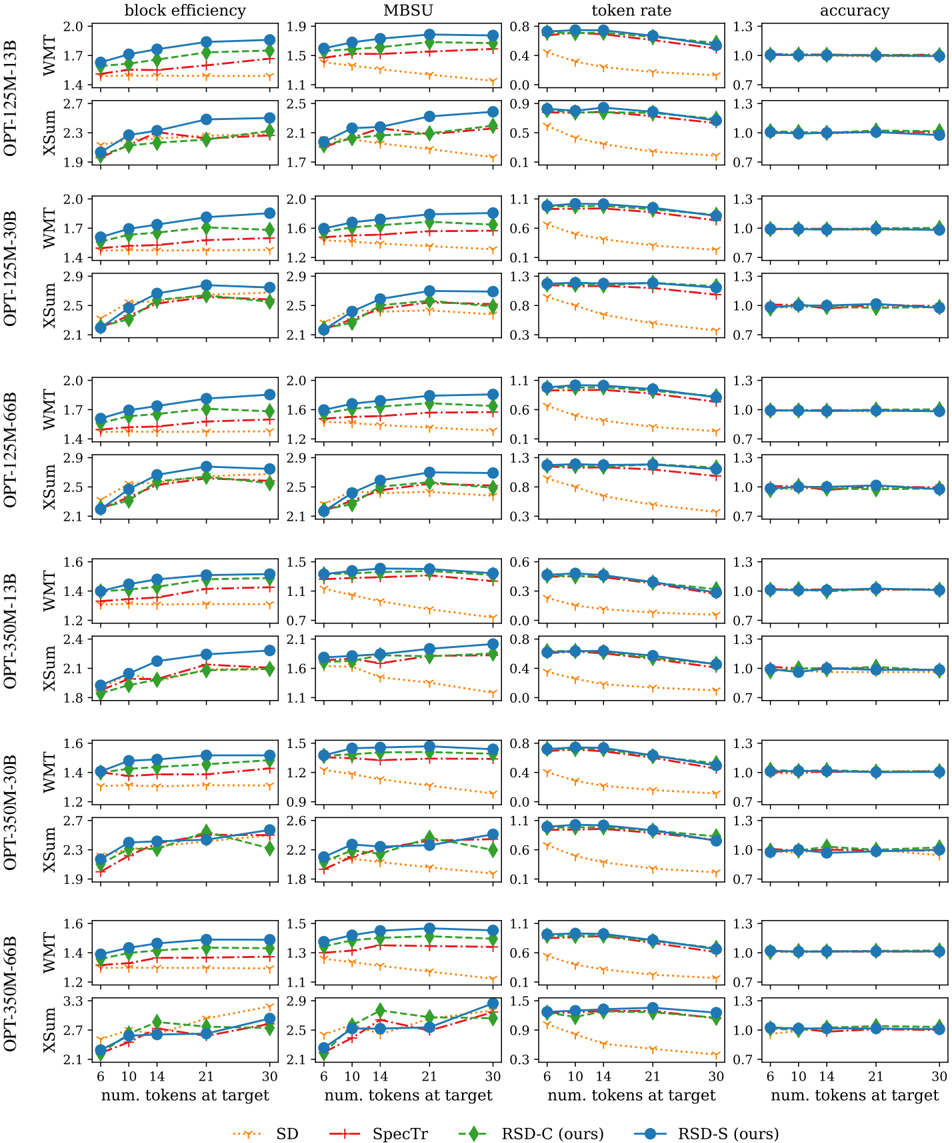
The image is a multi-panel line chart comparing performance metrics (block efficiency, MBSU, token rate, accuracy) across different models (OPT-125M-13B, OPT-125M-30B, OPT-125M-66B, OPT-350M-13B, OPT-350M-30B, OPT-350M-66B) and datasets (WMT, XSum). Each panel represents a metric, with lines showing trends as the number of tokens at target increases (6, 10, 14, 21, 30). Four methods are compared: SD (orange dotted), SpecTr (red dashed), RSD-C (green dashed), and RSD-S (blue solid).
### Components/Axes
- **X-axis**: "num. tokens at target" (values: 6, 10, 14, 21, 30) across all panels.
- **Y-axes**: Vary per panel (e.g., block efficiency: 1.4–2.0, MBSU: 0.0–0.9, token rate: 0.1–1.3, accuracy: 0.7–1.3).
- **Legends**: Located at the bottom, with colors:
- Orange dotted: SD
- Red dashed: SpecTr
- Green dashed: RSD-C (ours)
- Blue solid: RSD-S (ours)
### Detailed Analysis
#### Block Efficiency (Top Panel)
- **Y-axis**: 1.4–2.0
- **Trends**:
- RSD-S (blue) starts at ~1.7 (6 tokens) and increases to ~1.9 (30 tokens).
- SpecTr (red) starts at ~1.5 and rises to ~1.8.
- RSD-C (green) fluctuates between ~1.6–1.8.
- SD (orange) remains lowest (~1.4–1.6).
- **Key Data Points**:
- At 6 tokens: RSD-S = 1.7, SpecTr = 1.5, RSD-C = 1.6, SD = 1.4.
- At 30 tokens: RSD-S = 1.9, SpecTr = 1.8, RSD-C = 1.8, SD = 1.6.
#### MBSU (Second Panel)
- **Y-axis**: 0.0–0.9
- **Trends**:
- RSD-S (blue) rises from ~0.3 (6 tokens) to ~0.8 (30 tokens).
- SpecTr (red) increases from ~0.2 to ~0.7.
- RSD-C (green) stays ~0.5–0.7.
- SD (orange) remains ~0.1–0.3.
- **Key Data Points**:
- At 6 tokens: RSD-S = 0.3, SpecTr = 0.2, RSD-C = 0.5, SD = 0.1.
- At 30 tokens: RSD-S = 0.8, SpecTr = 0.7, RSD-C = 0.7, SD = 0.3.
#### Token Rate (Third Panel)
- **Y-axis**: 0.1–1.3
- **Trends**:
- RSD-S (blue) starts at ~0.7 (6 tokens) and peaks at ~1.1 (30 tokens).
- SpecTr (red) increases from ~0.5 to ~0.9.
- RSD-C (green) stays ~0.6–0.9.
- SD (orange) remains ~0.2–0.4.
- **Key Data Points**:
- At 6 tokens: RSD-S = 0.7, SpecTr = 0.5, RSD-C = 0.6, SD = 0.2.
- At 30 tokens: RSD-S = 1.1, SpecTr = 0.9, RSD-C = 0.9, SD = 0.4.
#### Accuracy (Fourth Panel)
- **Y-axis**: 0.7–1.3
- **Trends**:
- All methods cluster tightly around 1.0–1.1, with minor fluctuations.
- RSD-S (blue) and SpecTr (red) show slight upward trends.
- RSD-C (green) and SD (orange) remain stable.
- **Key Data Points**:
- At 6 tokens: All methods ~1.0–1.1.
- At 30 tokens: RSD-S = 1.1, SpecTr = 1.1, RSD-C = 1.0, SD = 1.0.
### Key Observations
1. **Performance Scaling**: Block efficiency, MBSU, and token rate generally improve with more tokens, while accuracy remains stable.
2. **Method Comparison**:
- RSD-S (blue) and SpecTr (red) outperform RSD-C (green) and SD (orange) in block efficiency, MBSU, and token rate.
- Accuracy is relatively consistent across methods, with RSD-S and SpecTr showing marginal gains.
3. **Anomalies**:
- RSD-C (green) shows a dip in MBSU at 14 tokens (0.6 vs. 0.7 at 10 tokens) but recovers by 21 tokens.
- SD (orange) consistently lags in all metrics except accuracy.
### Interpretation
The data suggests that **RSD-S** and **SpecTr** are more efficient and effective in handling larger token targets compared to RSD-C and SD. Block efficiency and MBSU improve significantly with increased tokens, indicating scalability. Token rate trends align with these metrics, while accuracy remains robust across all methods. The consistent performance of RSD-S and SpecTr highlights their potential for applications requiring high token throughput without sacrificing accuracy. The slight dip in RSD-C’s MBSU at 14 tokens may indicate a transient inefficiency, but its recovery suggests resilience. SD’s underperformance across metrics warrants further investigation into its design or implementation.