\n
## Bar Charts: Token Generation Speed Comparison
### Overview
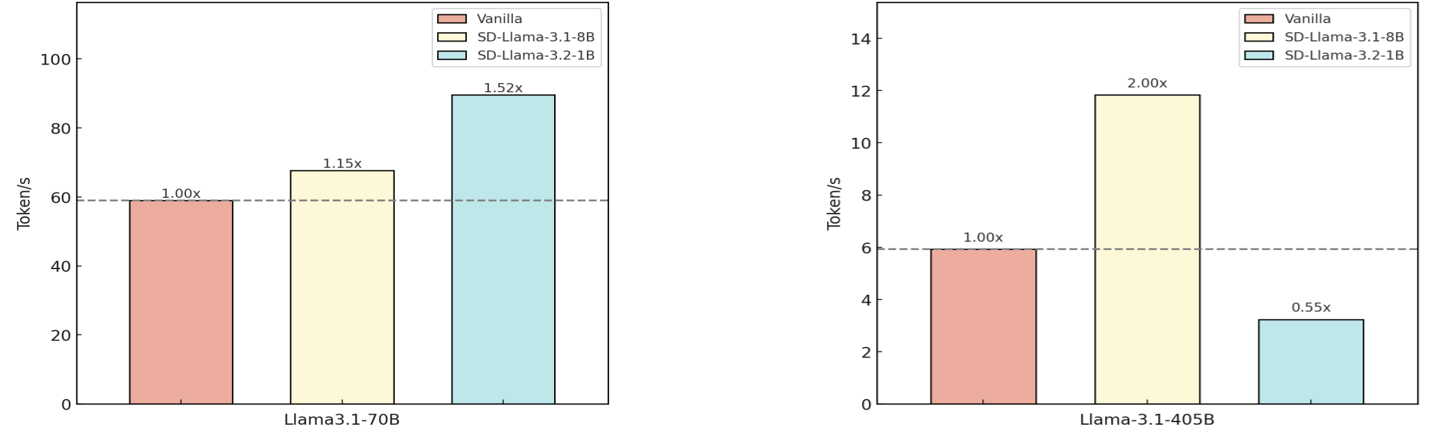
The image presents two bar charts comparing the token generation speed (Tokens/s) of different models: Vanilla, SD-Llama-3.1-8B, and SD-Llama-3.2-1B. The first chart focuses on the Llama3.1-70B model, while the second focuses on the Llama-3.1-405B model. A horizontal dashed line at 60 Tokens/s is present in the first chart, and at 6 Tokens/s in the second chart, serving as a reference point. Each bar is labeled with a relative speed multiplier (e.g., 1.00x, 1.15x).
### Components/Axes
* **X-axis:** Model Name (Llama3.1-70B, Llama-3.1-405B)
* **Y-axis:** Token Generation Speed (Tokens/s). The scale ranges from 0 to 100 in the first chart and 0 to 14 in the second chart.
* **Legend (Top-Right of each chart):**
* Red: Vanilla
* Yellow: SD-Llama-3.1-8B
* Light Blue: SD-Llama-3.2-1B
* **Reference Line:** A horizontal dashed line is present in each chart. The first chart has a line at approximately 60 Tokens/s, and the second at approximately 6 Tokens/s.
* **Multiplier Labels:** Each bar is labeled with a multiplier relative to the "Vanilla" model.
### Detailed Analysis or Content Details
**Chart 1: Llama3.1-70B**
* **Vanilla:** The Vanilla model achieves a token generation speed of approximately 42 Tokens/s, labeled as 1.00x.
* **SD-Llama-3.1-8B:** This model achieves a token generation speed of approximately 58 Tokens/s, labeled as 1.15x.
* **SD-Llama-3.2-1B:** This model achieves a token generation speed of approximately 84 Tokens/s, labeled as 1.52x.
**Chart 2: Llama-3.1-405B**
* **Vanilla:** The Vanilla model achieves a token generation speed of approximately 5 Tokens/s, labeled as 1.00x.
* **SD-Llama-3.1-8B:** This model achieves a token generation speed of approximately 12 Tokens/s, labeled as 2.00x.
* **SD-Llama-3.2-1B:** This model achieves a token generation speed of approximately 3 Tokens/s, labeled as 0.55x.
### Key Observations
* For the Llama3.1-70B model, SD-Llama-3.2-1B significantly outperforms both Vanilla and SD-Llama-3.1-8B in terms of token generation speed.
* For the Llama-3.1-405B model, SD-Llama-3.1-8B significantly outperforms both Vanilla and SD-Llama-3.2-1B.
* The relative performance of the SD models varies depending on the base model (70B vs. 405B).
* The reference lines provide a clear visual indication of performance thresholds.
### Interpretation
The data suggests that the SD-Llama models can significantly improve token generation speed compared to the Vanilla models, but the extent of the improvement is dependent on the underlying Llama model size. For the 70B model, the 3.2-1B variant provides the largest speedup. However, for the 405B model, the 3.1-8B variant is superior. This indicates a complex interaction between the SD-Llama optimization and the base model architecture. The multipliers provide a convenient way to quantify the performance gains. The horizontal lines likely represent a target or baseline performance level. The difference in performance between the two charts suggests that the benefits of the SD-Llama optimization may scale differently with model size. Further investigation would be needed to understand the reasons for this difference and to optimize the SD-Llama models for different Llama model sizes.