## Token Generation Speed Comparison Charts
### Overview
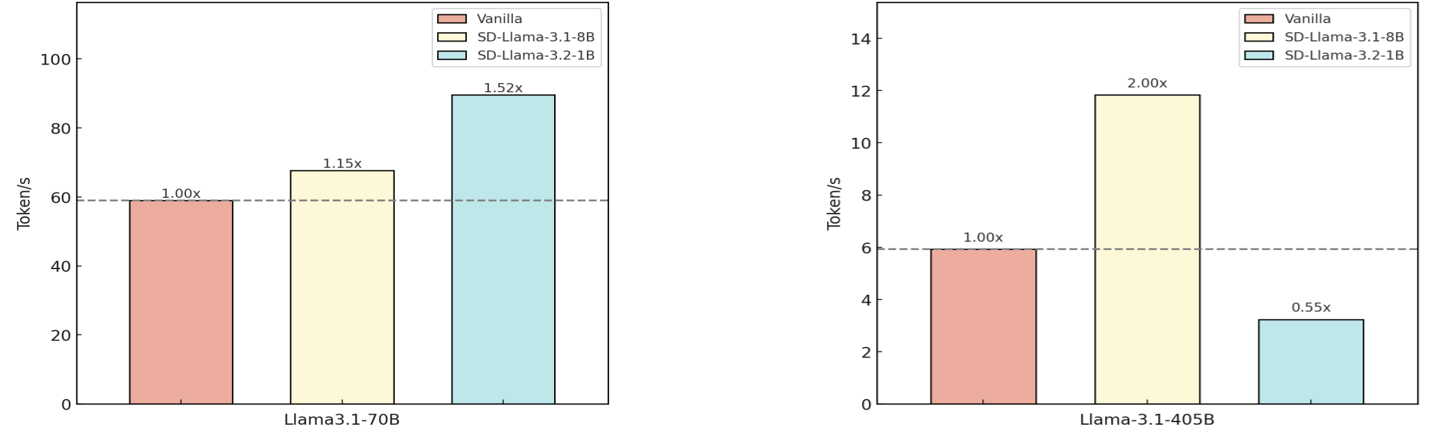
The image displays two side-by-side bar charts comparing the token generation speed (in tokens per second) of different configurations of the Llama language model. The left chart focuses on the "Llama3.1-70B" model, while the right chart focuses on the "Llama-3.1-405B" model. Each chart compares a "Vanilla" baseline against two "SD" (likely Speculative Decoding) variants.
### Components/Axes
* **Chart Type:** Vertical Bar Charts (2 instances).
* **Y-Axis (Both Charts):** Labeled "Token/s". The scale is linear.
* Left Chart (Llama3.1-70B): Range from 0 to 100, with major ticks at 0, 20, 40, 60, 80, 100.
* Right Chart (Llama-3.1-405B): Range from 0 to 14, with major ticks at 0, 2, 4, 6, 8, 10, 12, 14.
* **X-Axis (Both Charts):** Each chart has a single categorical label centered below its bars.
* Left Chart: "Llama3.1-70B"
* Right Chart: "Llama-3.1-405B"
* **Legend (Top-Right of each chart):** A shared legend defines three data series:
1. **Vanilla:** Represented by a light salmon/pink bar.
2. **SD-Llama-3.1-8B:** Represented by a pale yellow/cream bar.
3. **SD-Llama-3.2-1B:** Represented by a light cyan/aqua bar.
* **Baseline Reference:** A dashed horizontal grey line extends from the top of the "Vanilla" bar across each chart, serving as a visual baseline for the 1.00x multiplier.
### Detailed Analysis
**Left Chart: Llama3.1-70B**
* **Vanilla (Pink Bar):** Height corresponds to approximately 60 Token/s. A label above it reads "1.00x".
* **SD-Llama-3.1-8B (Yellow Bar):** Height is greater than Vanilla, approximately 69 Token/s. A label above it reads "1.15x".
* **SD-Llama-3.2-1B (Cyan Bar):** The tallest bar, height approximately 91 Token/s. A label above it reads "1.52x".
* **Trend:** Both SD variants show increased token generation speed compared to the Vanilla baseline for the 70B model. The speedup increases from the 8B to the 1B SD configuration.
**Right Chart: Llama-3.1-405B**
* **Vanilla (Pink Bar):** Height corresponds to approximately 6 Token/s. A label above it reads "1.00x".
* **SD-Llama-3.1-8B (Yellow Bar):** The tallest bar, height approximately 12 Token/s. A label above it reads "2.00x".
* **SD-Llama-3.2-1B (Cyan Bar):** Height is less than Vanilla, approximately 3.3 Token/s. A label above it reads "0.55x".
* **Trend:** The results are mixed for the 405B model. The SD-Llama-3.1-8B configuration provides a significant 2x speedup, while the SD-Llama-3.2-1B configuration results in a performance degradation (0.55x the speed of Vanilla).
### Key Observations
1. **Model Size Impact:** The absolute token/s values are an order of magnitude higher for the 70B model (tens of tokens/s) compared to the 405B model (single digits of tokens/s), reflecting the increased computational cost of the larger model.
2. **Inconsistent SD Performance:** The effectiveness of Speculative Decoding (SD) is highly dependent on both the target model size (70B vs. 405B) and the specific SD model used (3.1-8B vs. 3.2-1B).
3. **Dramatic Slowdown:** The most notable outlier is the SD-Llama-3.2-1B configuration on the 405B model, which cuts performance nearly in half compared to the baseline, suggesting a poor match or overhead that negates any speculative benefit.
4. **Optimal Pairing:** For the 70B model, the smaller SD model (3.2-1B) yields the best speedup. For the 405B model, the larger SD model (3.1-8B) is optimal.
### Interpretation
These charts demonstrate the practical performance trade-offs when applying Speculative Decoding to accelerate large language model inference. Speculative Decoding uses a smaller, faster "draft" model to propose tokens, which are then verified by the larger "target" model, aiming to increase overall throughput.
The data suggests that the choice of draft model is critical and not universally beneficial. A well-matched draft model (like SD-Llama-3.1-8B for the 405B target) can double inference speed. However, a poorly matched draft model (like SD-Llama-3.2-1B for the 405B target) can introduce significant overhead, likely due to a high rejection rate of proposed tokens, forcing the large model to do more work and slowing down the process. The inverse relationship seen here—where the smaller draft model works better for the smaller target and the larger draft model works better for the larger target—implies that alignment in model architecture, training data, or capability between the draft and target models is a key factor for successful acceleration. The charts provide empirical evidence that speculative decoding is a powerful but nuanced optimization technique requiring careful configuration.