## Bar Chart: Performance Metrics Comparison
### Overview
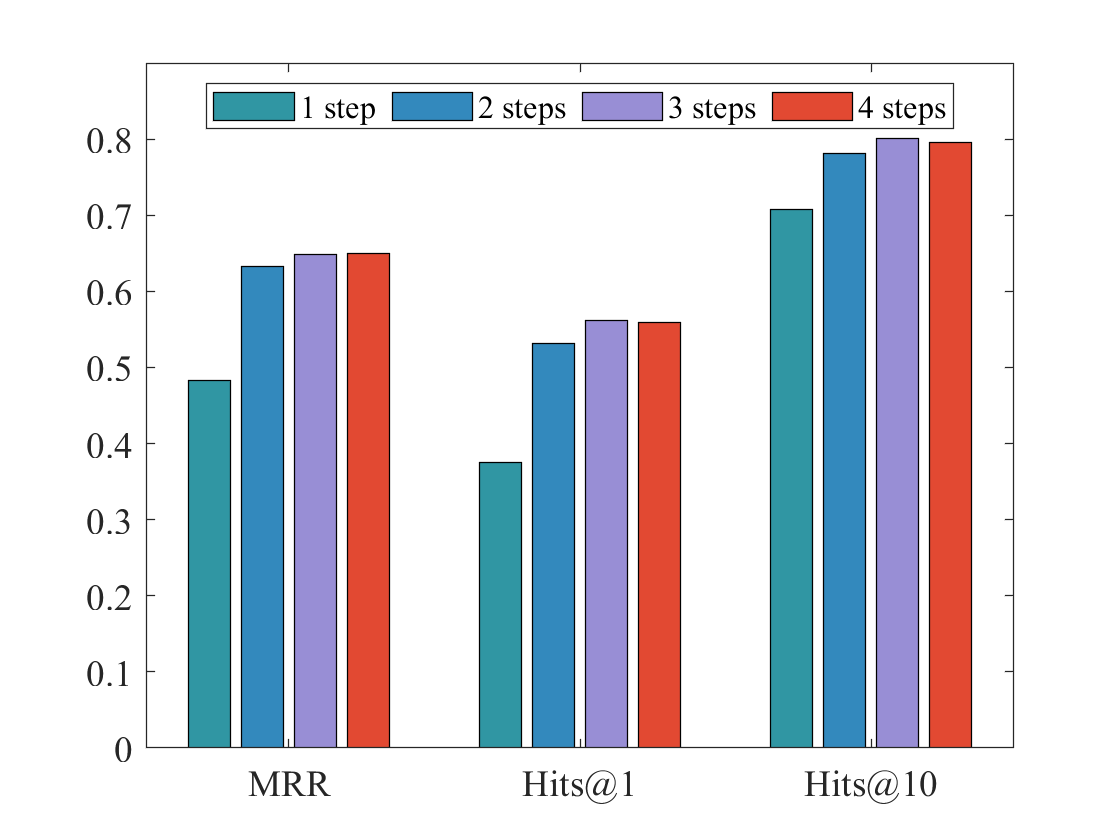
The image is a bar chart comparing the performance of a model across three metrics (MRR, Hits@1, Hits@10) using different numbers of steps (1, 2, 3, and 4). The y-axis represents the score for each metric, ranging from 0 to 0.8. The x-axis represents the three metrics being evaluated.
### Components/Axes
* **X-axis:** Categorical axis with three categories: MRR, Hits@1, and Hits@10.
* **Y-axis:** Numerical axis ranging from 0 to 0.8, with increments of 0.1.
* **Legend:** Located at the top-left of the chart, indicating the number of steps:
* Teal: 1 step
* Blue: 2 steps
* Purple: 3 steps
* Red: 4 steps
### Detailed Analysis
**MRR (Mean Reciprocal Rank):**
* 1 step (Teal): Approximately 0.49
* 2 steps (Blue): Approximately 0.64
* 3 steps (Purple): Approximately 0.65
* 4 steps (Red): Approximately 0.66
**Hits@1:**
* 1 step (Teal): Approximately 0.38
* 2 steps (Blue): Approximately 0.54
* 3 steps (Purple): Approximately 0.57
* 4 steps (Red): Approximately 0.57
**Hits@10:**
* 1 step (Teal): Approximately 0.71
* 2 steps (Blue): Approximately 0.79
* 3 steps (Purple): Approximately 0.80
* 4 steps (Red): Approximately 0.80
### Key Observations
* For all three metrics, performance generally increases as the number of steps increases from 1 to 2.
* The performance increase from 2 steps to 3 steps is smaller than the increase from 1 step to 2 steps.
* The performance increase from 3 steps to 4 steps is minimal, suggesting diminishing returns.
* Hits@10 consistently shows the highest scores compared to MRR and Hits@1 for all step values.
* Hits@1 consistently shows the lowest scores compared to MRR and Hits@10 for all step values.
### Interpretation
The bar chart illustrates the impact of varying the number of steps on the model's performance across different ranking metrics. The data suggests that increasing the number of steps generally improves performance, but the gains diminish beyond 2 steps. The Hits@10 metric, which measures whether the correct item is within the top 10 results, consistently outperforms MRR and Hits@1, indicating that the model is better at including the correct item in the broader top 10 list than at ranking it higher. The relatively low Hits@1 scores suggest that the model struggles to place the correct item at the very top of the ranking. The diminishing returns observed with increasing steps could be due to factors such as overfitting or the model reaching its inherent capacity.