\n
## Bar Chart: Performance Comparison by Step Count
### Overview
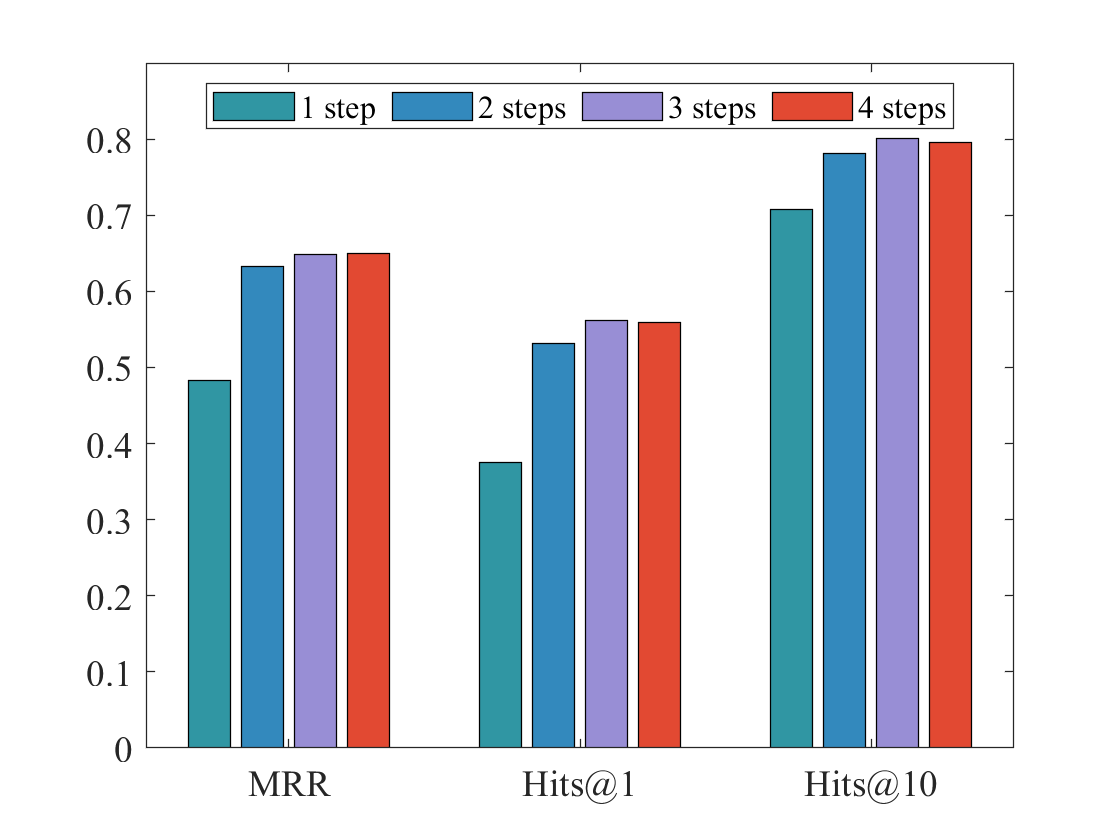
The image presents a bar chart comparing the performance of a system across different numbers of steps (1, 2, 3, and 4) using three metrics: MRR (Mean Reciprocal Rank), Hits@1, and Hits@10. The chart visually represents how performance changes as the number of steps increases for each metric.
### Components/Axes
* **X-axis:** Represents the evaluation metrics: "MRR", "Hits@1", and "Hits@10".
* **Y-axis:** Represents the performance score, ranging from 0 to approximately 0.85.
* **Legend:** Located at the top of the chart, identifies the different step counts with corresponding colors:
* 1 step (Teal)
* 2 steps (Light Blue)
* 3 steps (Lavender)
* 4 steps (Red)
### Detailed Analysis
The chart consists of three groups of bars, one for each metric. Within each group, there are four bars representing the performance at 1, 2, 3, and 4 steps.
**MRR:**
* 1 step: Approximately 0.48
* 2 steps: Approximately 0.63
* 3 steps: Approximately 0.65
* 4 steps: Approximately 0.67
*Trend:* The MRR score generally increases with the number of steps, with diminishing returns after 2 steps.
**Hits@1:**
* 1 step: Approximately 0.39
* 2 steps: Approximately 0.56
* 3 steps: Approximately 0.58
* 4 steps: Approximately 0.59
*Trend:* The Hits@1 score increases significantly from 1 to 2 steps, then plateaus with smaller gains at 3 and 4 steps.
**Hits@10:**
* 1 step: Approximately 0.73
* 2 steps: Approximately 0.78
* 3 steps: Approximately 0.82
* 4 steps: Approximately 0.85
*Trend:* The Hits@10 score consistently increases with the number of steps, showing a clear positive correlation.
### Key Observations
* The largest performance gains are observed when increasing the number of steps from 1 to 2 for all metrics.
* Hits@10 consistently demonstrates the highest performance scores across all step counts.
* The improvement in MRR and Hits@1 diminishes as the number of steps increases beyond 2.
* The performance difference between 3 and 4 steps is minimal for all metrics.
### Interpretation
The data suggests that increasing the number of steps in the system generally improves performance, particularly for Hits@10. However, there appears to be a point of diminishing returns, where adding more steps yields only marginal improvements. This could indicate that the system reaches a level of optimization after a certain number of steps, and further steps do not significantly enhance its ability to rank or retrieve relevant results. The substantial improvement from 1 to 2 steps suggests that the initial step is crucial for establishing a baseline level of performance, and the second step refines the results considerably. The relatively stable performance between 3 and 4 steps suggests that the system is approaching its maximum potential within the evaluated framework. The difference in performance between the metrics indicates that the system is better at retrieving a single relevant result (Hits@10) than at ranking the most relevant result at the top (MRR).