## Bar Chart: Performance Metrics by Step Count
### Overview
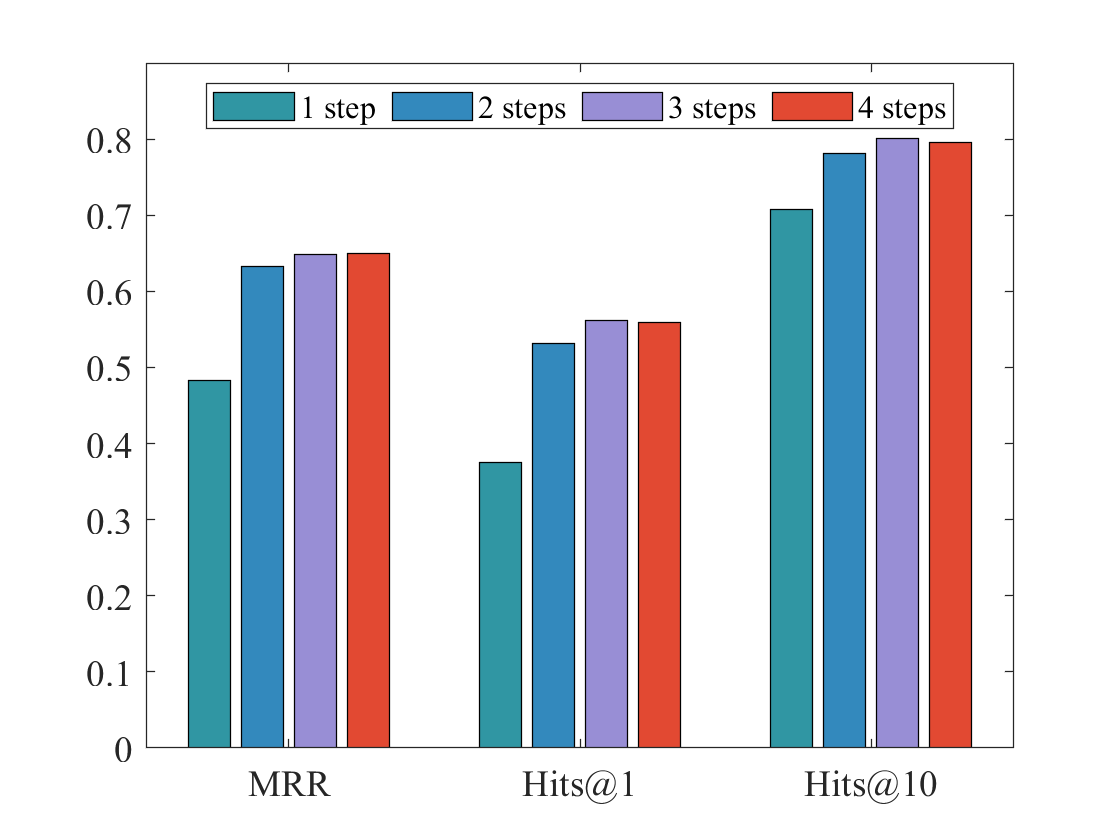
The image is a grouped bar chart comparing the performance of a system across three evaluation metrics (MRR, Hits@1, Hits@10) when configured with 1, 2, 3, or 4 steps. The chart demonstrates how increasing the number of steps generally improves performance, with diminishing returns observed after 3 steps.
### Components/Axes
* **Chart Type:** Grouped vertical bar chart.
* **X-Axis (Categories):** Three distinct metric groups are labeled at the bottom:
* `MRR` (Mean Reciprocal Rank)
* `Hits@1`
* `Hits@10`
* **Y-Axis (Scale):** A linear numerical scale on the left, ranging from `0` to `0.8` with major tick marks at every `0.1` interval (0, 0.1, 0.2, 0.3, 0.4, 0.5, 0.6, 0.7, 0.8).
* **Legend:** Positioned at the top-center of the chart area. It defines four data series by color:
* **Teal bar:** `1 step`
* **Blue bar:** `2 steps`
* **Light Purple bar:** `3 steps`
* **Red bar:** `4 steps`
### Detailed Analysis
The chart presents approximate numerical values for each bar, derived from visual inspection against the y-axis scale.
**1. MRR Group (Leftmost cluster):**
* **Trend:** Performance increases sharply from 1 to 2 steps, then more gradually to 3 steps, with 4 steps showing no further gain.
* **Data Points (Approximate):**
* 1 step (Teal): ~0.48
* 2 steps (Blue): ~0.63
* 3 steps (Purple): ~0.65
* 4 steps (Red): ~0.65 (appears equal to or marginally lower than 3 steps)
**2. Hits@1 Group (Middle cluster):**
* **Trend:** A similar pattern to MRR: a large jump from 1 to 2 steps, a smaller increase to 3 steps, and a plateau at 4 steps.
* **Data Points (Approximate):**
* 1 step (Teal): ~0.38
* 2 steps (Blue): ~0.53
* 3 steps (Purple): ~0.56
* 4 steps (Red): ~0.56 (appears equal to 3 steps)
**3. Hits@10 Group (Rightmost cluster):**
* **Trend:** This metric shows the highest absolute values. Performance improves from 1 to 3 steps, with 3 steps achieving the peak. The 4-step configuration shows a very slight decrease compared to 3 steps.
* **Data Points (Approximate):**
* 1 step (Teal): ~0.71
* 2 steps (Blue): ~0.78
* 3 steps (Purple): ~0.80
* 4 steps (Red): ~0.79 (slightly lower than 3 steps)
### Key Observations
1. **Consistent Hierarchy:** For all three metrics, the `1 step` configuration performs the worst, and the `3 steps` configuration performs the best or ties for best.
2. **Diminishing Returns:** The most significant performance gain occurs when moving from `1 step` to `2 steps`. The gain from `2 steps` to `3 steps` is positive but smaller. Moving from `3 steps` to `4 steps` yields no improvement (MRR, Hits@1) or a negligible decline (Hits@10).
3. **Metric Sensitivity:** The `Hits@10` metric shows the highest overall scores, indicating the system is more successful at placing a correct answer within the top 10 results than at placing it first (Hits@1) or achieving a high reciprocal rank (MRR).
4. **Visual Anomaly:** The `4 steps` (Red) bar in the `Hits@10` group is visually just a fraction shorter than the `3 steps` (Purple) bar, suggesting a potential slight performance degradation or noise at the highest step count for this metric.
### Interpretation
This chart likely evaluates a multi-step reasoning or retrieval process in an AI or information system. The data suggests a clear **optimal operating point at 3 steps**.
* **Performance vs. Cost:** The primary insight is that increasing computational steps improves output quality, but only up to a point. The system exhibits a classic "sweet spot" at 3 steps, where performance is maximized. Adding a fourth step appears to be inefficient, consuming more resources for no benefit or even a slight loss in accuracy (as seen in Hits@10). This could indicate over-processing, error accumulation, or that the problem's complexity is fully addressed within three steps.
* **Metric Relationship:** The consistent pattern across MRR, Hits@1, and Hits@10 reinforces the robustness of the finding. The system's ability to rank the correct answer highly (Hits@10) is strong, but its precision in ranking it first (Hits@1) is more sensitive to the step count, showing the largest relative improvement from 1 to 3 steps.
* **Practical Implication:** For deployment, configuring the system with 3 steps would be recommended to balance performance and computational cost. The 4-step configuration offers no advantage and may be wasteful. The significant gap between 1-step and multi-step performance underscores the necessity of the multi-step process for this task.