## Bar Chart: Inference Time Comparison for Language Models on A100 and RTX3090
### Overview
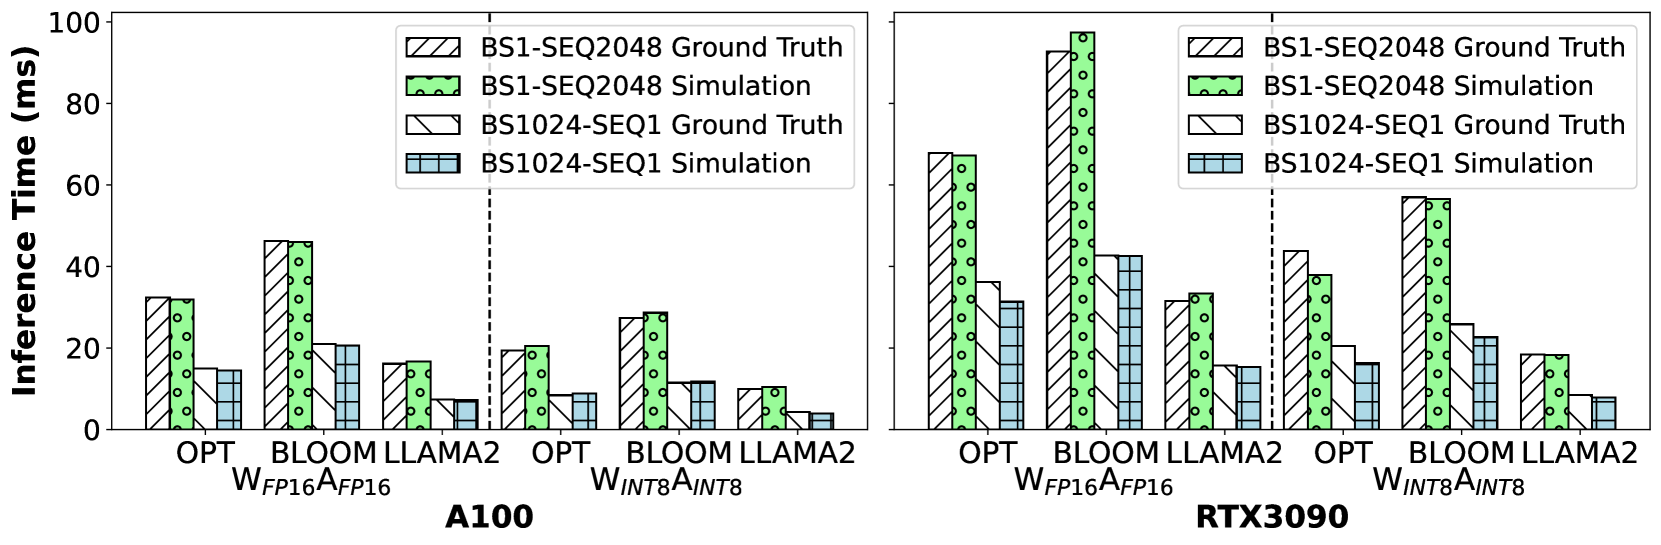
The image is a grouped bar chart comparing inference times (in milliseconds) for three language models (OPT, BLOOM, LLaMA2) across two hardware platforms (A100, RTX3090). Each model is evaluated under two weight configurations (FP16 and INT8) and two data types (Ground Truth vs. Simulation). The chart highlights performance differences between hardware and model configurations.
### Components/Axes
- **X-Axis**:
- Models: OPT, BLOOM, LLaMA2
- Weight Configurations:
- `W_FP16A_FP16` (FP16 precision)
- `W_INT8A_INT8` (INT8 precision)
- Data Types: Ground Truth (solid patterns) and Simulation (hatched patterns)
- **Y-Axis**: Inference Time (ms), scaled from 0 to 100.
- **Legend**:
- Top-right corner, with four entries:
1. **BS1-SEQ2048 Ground Truth** (striped)
2. **BS1-SEQ2048 Simulation** (dotted)
3. **BS1024-SEQ1 Ground Truth** (solid)
4. **BS1024-SEQ1 Simulation** (checkered)
- **Spatial Layout**:
- Two main sections (A100 and RTX3090) side-by-side.
- Each section contains grouped bars for models, weight configurations, and data types.
### Detailed Analysis
#### A100 Hardware
- **OPT**:
- `W_FP16A_FP16`:
- Ground Truth: ~30 ms (solid)
- Simulation: ~35 ms (striped)
- `W_INT8A_INT8`:
- Ground Truth: ~15 ms (solid)
- Simulation: ~10 ms (striped)
- **BLOOM**:
- `W_FP16A_FP16`:
- Ground Truth: ~45 ms (solid)
- Simulation: ~40 ms (striped)
- `W_INT8A_INT8`:
- Ground Truth: ~20 ms (solid)
- Simulation: ~12 ms (striped)
- **LLaMA2**:
- `W_FP16A_FP16`:
- Ground Truth: ~25 ms (solid)
- Simulation: ~22 ms (striped)
- `W_INT8A_INT8`:
- Ground Truth: ~10 ms (solid)
- Simulation: ~8 ms (striped)
#### RTX3090 Hardware
- **OPT**:
- `W_FP16A_FP16`:
- Ground Truth: ~70 ms (solid)
- Simulation: ~75 ms (striped)
- `W_INT8A_INT8`:
- Ground Truth: ~40 ms (solid)
- Simulation: ~35 ms (striped)
- **BLOOM**:
- `W_FP16A_FP16`:
- Ground Truth: ~95 ms (solid)
- Simulation: ~90 ms (striped)
- `W_INT8A_INT8`:
- Ground Truth: ~55 ms (solid)
- Simulation: ~50 ms (striped)
- **LLaMA2**:
- `W_FP16A_FP16`:
- Ground Truth: ~60 ms (solid)
- Simulation: ~58 ms (striped)
- `W_INT8A_INT8`:
- Ground Truth: ~30 ms (solid)
- Simulation: ~28 ms (striped)
### Key Observations
1. **Simulation vs. Ground Truth**:
- Simulation times are consistently higher than ground truth across all models and hardware (e.g., OPT on A100: 35 ms vs. 30 ms).
- Exceptions: LLaMA2 `W_INT8A_INT8` on A100 shows simulation slightly lower than ground truth (~8 ms vs. ~10 ms).
2. **Hardware Performance**:
- RTX3090 inference times are significantly higher than A100 (e.g., BLOOM `W_FP16A_FP16` on RTX3090: 95 ms vs. A100: 45 ms).
3. **Weight Precision**:
- INT8 configurations generally reduce inference times compared to FP16 (e.g., BLOOM on A100: 20 ms vs. 45 ms for FP16).
4. **Model Efficiency**:
- LLaMA2 has the lowest inference times across both hardware and weight configurations.
### Interpretation
- **Simulation Overhead**: The consistent increase in simulation times suggests computational overhead in simulated environments, possibly due to additional validation or emulation layers.
- **Hardware Impact**: A100 outperforms RTX3090 by ~30-50% in inference times, indicating better optimization for these models.
- **INT8 Advantage**: Lower precision (INT8) reduces inference times but may introduce accuracy trade-offs, as simulations sometimes negate this benefit.
- **Model-Specific Trends**: LLaMA2’s efficiency across configurations suggests architectural optimizations, while BLOOM’s higher RTX3090 times may reflect larger model size or memory constraints.
This analysis underscores the importance of hardware selection and weight precision in deploying language models, with simulations often reflecting real-world performance gaps.