## Line Chart: Model Performance Scores
### Overview
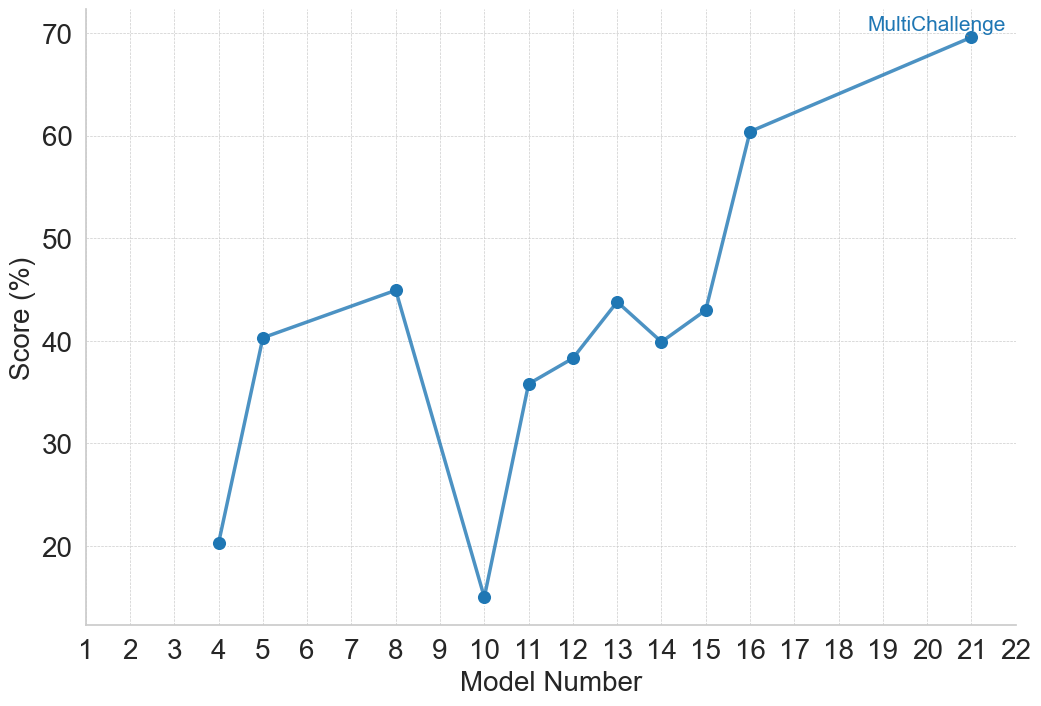
The image is a line chart displaying the performance scores of different models. The x-axis represents the model number, ranging from 1 to 22, and the y-axis represents the score in percentage. The chart shows the performance of models, with a notable increase towards the higher model numbers, specifically model 16 and beyond. The highest performing model is labeled "MultiChallenge".
### Components/Axes
* **X-axis:** Model Number, ranging from 1 to 22.
* **Y-axis:** Score (%), ranging from 20 to 70.
* **Data Series:** A single blue line representing the performance score of each model.
* **Label:** "MultiChallenge" is positioned near the data point for Model 21.
### Detailed Analysis
The blue line represents the performance score of each model.
* **Model 4:** Score is approximately 20%.
* **Model 5:** Score is approximately 40%.
* **Model 8:** Score is approximately 45%.
* **Model 10:** Score is approximately 15%.
* **Model 11:** Score is approximately 36%.
* **Model 13:** Score is approximately 44%.
* **Model 14:** Score is approximately 40%.
* **Model 16:** Score is approximately 60%.
* **Model 21 (MultiChallenge):** Score is approximately 69%.
**Trend Analysis:**
* From Model 4 to Model 8, the score increases.
* From Model 8 to Model 10, the score decreases significantly.
* From Model 10 to Model 13, the score increases.
* From Model 13 to Model 14, the score decreases slightly.
* From Model 14 to Model 16, the score increases sharply.
* From Model 16 to Model 21, the score increases gradually.
### Key Observations
* Model 10 has the lowest score among all models.
* Model 21, labeled "MultiChallenge," has the highest score.
* There is a significant performance jump between Model 14 and Model 16.
### Interpretation
The chart illustrates the performance of different models, with "MultiChallenge" (Model 21) outperforming the others. The performance varies significantly across the models, suggesting that certain model configurations or parameters are more effective than others. The sharp increase in performance from Model 14 to Model 16 indicates a potentially significant change or improvement in the model design or training process. The low score of Model 10 could indicate a flawed configuration or a need for further optimization. Overall, the data suggests that iterative model development and optimization are crucial for achieving high performance.