\n
## Line Chart: Model Performance Score
### Overview
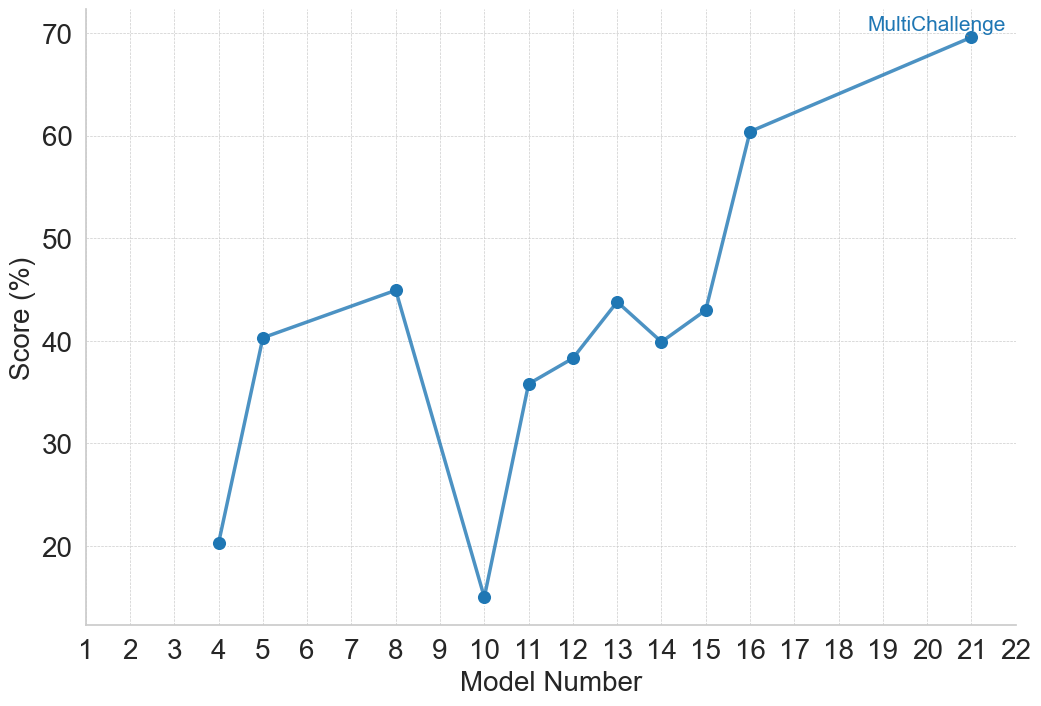
This image presents a line chart illustrating the performance score (in percentage) of a model across different model numbers, ranging from 1 to 22. The chart shows a generally increasing trend in score with some fluctuations. The final data point is labeled "MultiChallenge".
### Components/Axes
* **X-axis:** "Model Number" - ranging from 1 to 22, with integer increments.
* **Y-axis:** "Score (%)" - ranging from 0 to 70, with integer increments of 10.
* **Data Series:** A single blue line representing the model's score.
* **Label:** "MultiChallenge" - positioned at the end of the line (Model 22).
* **Grid:** A light gray grid is present in the background, aiding in reading values.
### Detailed Analysis
The blue line starts at approximately 21% at Model Number 4, increases to around 41% at Model Number 6, then peaks at approximately 46% at Model Number 9. It then sharply declines to a low of around 18% at Model Number 10. The line then rises again, reaching approximately 43% at Model Number 13, dips to around 39% at Model Number 15, and then experiences a significant increase, reaching approximately 59% at Model Number 16. The line continues to rise, reaching approximately 68% at Model Number 20, and finally reaching approximately 69% at Model Number 22, labeled "MultiChallenge".
Here's a breakdown of approximate data points:
* Model 4: 21%
* Model 6: 41%
* Model 9: 46%
* Model 10: 18%
* Model 13: 43%
* Model 15: 39%
* Model 16: 59%
* Model 20: 68%
* Model 22 (MultiChallenge): 69%
### Key Observations
* The most significant drop in score occurs between Model Numbers 9 and 10.
* The most substantial increase in score happens between Model Numbers 15 and 16.
* The score generally increases over the range of model numbers, with fluctuations.
* The final model, labeled "MultiChallenge", achieves the highest score.
### Interpretation
The chart demonstrates the iterative improvement of a model's performance as it undergoes development (represented by increasing model numbers). The initial fluctuations suggest a period of experimentation and refinement. The sharp drop at Model 10 could indicate a problematic change or bug introduced during that iteration. The subsequent recovery and strong increase from Model 16 onwards suggest successful optimization or correction of the issue. The "MultiChallenge" label at the end implies that this final model was tested on a more complex or diverse set of challenges, and it achieved a high score of approximately 69%. The overall trend indicates that the model is becoming more effective with each iteration, culminating in a robust performance on the "MultiChallenge" dataset. The data suggests a learning process where initial instability is overcome to achieve a high level of performance.