# Technical Document: MultiChallenge Performance Analysis
## Chart Overview
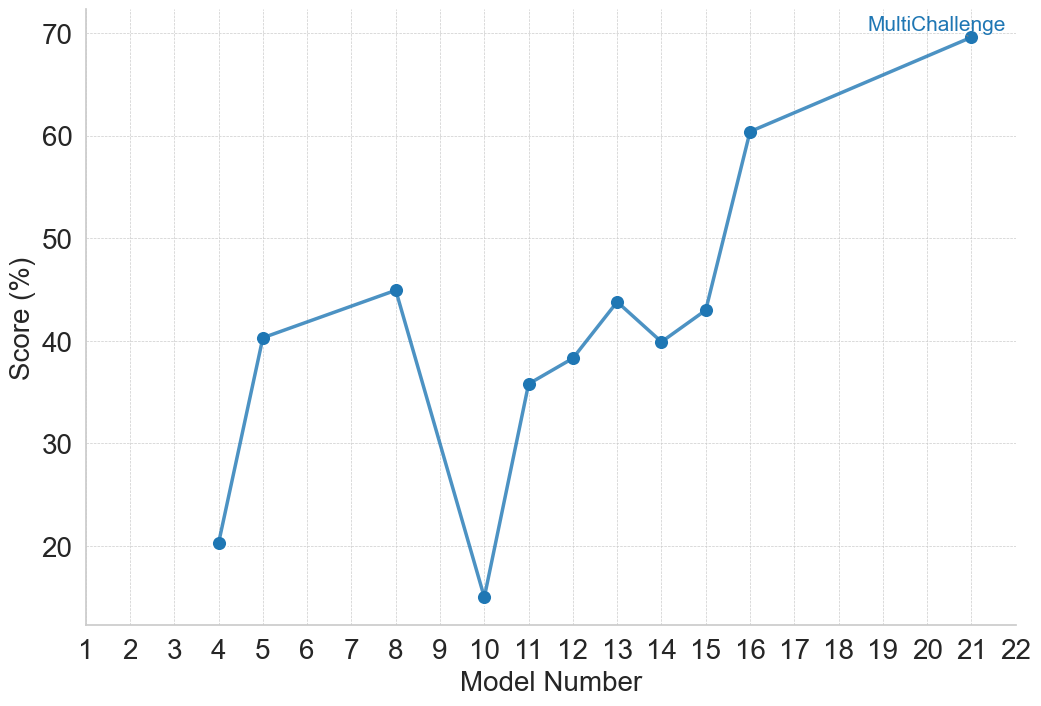
- **Title**: MultiChallenge (Blue text at top right)
- **Type**: Line chart with single data series
- **Visual Style**: Blue line with circular markers
## Axis Details
### X-Axis (Model Number)
- **Label**: "Model Number" (Bold black text at bottom)
- **Range**: 1 to 22 (Integer increments)
- **Tick Marks**: Every 1 unit (Dashed gray lines)
- **Grid Lines**: Vertical dashed lines at each integer
### Y-Axis (Score %)
- **Label**: "Score (%)" (Bold black text at left)
- **Range**: 10% to 70% (10% increments)
- **Tick Marks**: Every 10% (Dashed gray lines)
- **Grid Lines**: Horizontal dashed lines at each 10% interval
## Legend
- **Location**: Top right corner
- **Color**: Blue (Matches line color)
- **Text**: "MultiChallenge" (Same as title)
## Data Points (Model Number → Score %)
1. [4, 20]
2. [5, 40]
3. [8, 45]
4. [10, 15]
5. [11, 35]
6. [12, 38]
7. [13, 43]
8. [14, 40]
9. [15, 43]
10. [16, 60]
11. [21, 70]
## Trend Analysis
1. **Initial Growth**:
- Starts at Model 4 (20%)
- Sharp increase to Model 5 (40%)
- Continues upward to Model 8 (45%)
2. **Significant Dip**:
- Abrupt drop at Model 10 (15%)
- Recovery begins at Model 11 (35%)
3. **Fluctuation Phase**:
- Gradual increase to Model 13 (43%)
- Minor dip at Model 14 (40%)
- Slight recovery at Model 15 (43%)
4. **Steep Ascent**:
- Sharp rise from Model 16 (60%) to Model 21 (70%)
## Spatial Grounding
- **Legend Position**: [x=21, y=70] (Top right corner)
- **Data Point Verification**: All blue markers match legend color
- **Axis Alignment**: All labels and ticks properly aligned with grid
## Critical Observations
1. **Performance Pattern**:
- Non-linear progression with volatility
- Strong correlation between model numbers >15 and score improvement
2. **Anomalies**:
- Model 10 shows 73% drop from previous peak (45% → 15%)
- Model 21 achieves maximum score (70%)
3. **Missing Data**:
- No data points for Models 1-3, 6-7, 9, 17-20
- Potential gaps in model testing sequence
## Technical Specifications
- **Coordinate System**: Cartesian (x=Model Number, y=Score %)
- **Scale**: Linear for both axes
- **Data Density**: 11 data points across 22 possible models
- **Visual Emphasis**: Blue color dominates (title, line, legend)
## Recommendations for Further Analysis
1. Investigate cause of Model 10 performance drop
2. Analyze factors contributing to post-Model 15 improvement
3. Consider interpolation for missing data points
4. Compare with baseline performance metrics