## Scatter Plot Grid: Fraction of Variance in Centered and Averaged Activations Explained by PCs
### Overview
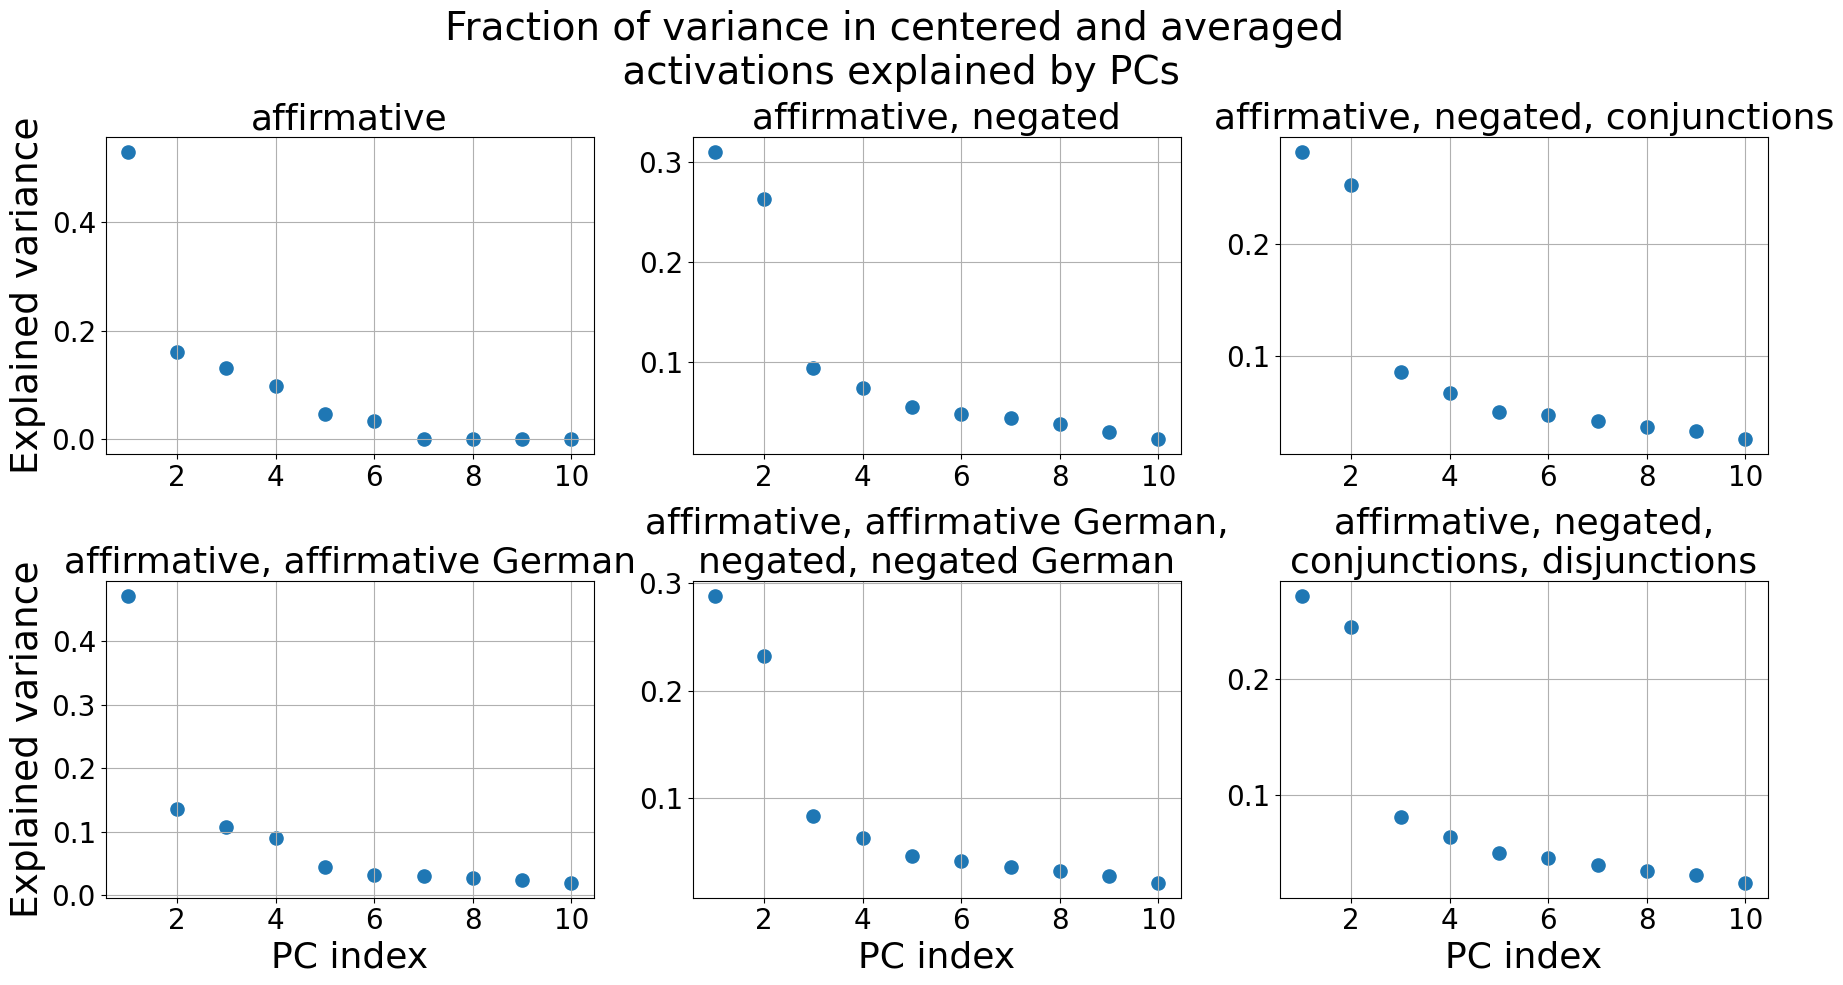
The image displays a 2x3 grid of scatter plots comparing the fraction of variance explained by principal components (PCs) across different linguistic conditions. Each subplot visualizes how explained variance decreases with increasing PC index (1–10) for specific combinations of linguistic features (e.g., affirmative/negated terms, German language variants, conjunctions/disjunctions). All plots use blue data points with no explicit legend.
### Components/Axes
- **X-axis**: "PC index" (1–10), labeled uniformly across all subplots.
- **Y-axis**: "Explained variance" (0–0.4), labeled uniformly across all subplots.
- **Subplot Titles**:
1. Top-left: "affirmative"
2. Top-middle: "affirmative, negated"
3. Top-right: "affirmative, negated, conjunctions"
4. Bottom-left: "affirmative, affirmative German"
5. Bottom-middle: "affirmative, affirmative German, negated, negated German"
6. Bottom-right: "affirmative, negated, conjunctions, disjunctions"
### Detailed Analysis
1. **Top-left ("affirmative")**:
- Highest explained variance at PC 1 (~0.45).
- Sharp decline to near-zero by PC 10.
- Data points: (1, ~0.45), (2, ~0.18), (3, ~0.15), (4, ~0.12), (5–10, ~0.02–0.05).
2. **Top-middle ("affirmative, negated")**:
- Explained variance starts at ~0.3 at PC 1.
- Gradual decline to ~0.05 by PC 10.
- Data points: (1, ~0.3), (2, ~0.2), (3, ~0.15), (4, ~0.1), (5–10, ~0.05–0.08).
3. **Top-right ("affirmative, negated, conjunctions")**:
- Starts at ~0.25 at PC 1.
- Steady decline to ~0.05 by PC 10.
- Data points: (1, ~0.25), (2, ~0.2), (3, ~0.15), (4, ~0.1), (5–10, ~0.05–0.07).
4. **Bottom-left ("affirmative, affirmative German")**:
- Explained variance peaks at ~0.4 at PC 1.
- Rapid drop to ~0.05 by PC 10.
- Data points: (1, ~0.4), (2, ~0.15), (3, ~0.1), (4, ~0.08), (5–10, ~0.03–0.06).
5. **Bottom-middle ("affirmative, affirmative German, negated, negated German")**:
- Starts at ~0.3 at PC 1.
- Gradual decline to ~0.05 by PC 10.
- Data points: (1, ~0.3), (2, ~0.2), (3, ~0.15), (4, ~0.1), (5–10, ~0.05–0.08).
6. **Bottom-right ("affirmative, negated, conjunctions, disjunctions")**:
- Explained variance begins at ~0.25 at PC 1.
- Slow decline to ~0.05 by PC 10.
- Data points: (1, ~0.25), (2, ~0.2), (3, ~0.15), (4, ~0.1), (5–10, ~0.05–0.07).
### Key Observations
- **Decreasing Trend**: All subplots show a consistent decline in explained variance as PC index increases, indicating diminishing returns in variance explained by higher-order PCs.
- **Highest Variance**: The "affirmative" condition (top-left) explains the most variance (~0.45 at PC 1), followed by "affirmative, affirmative German" (~0.4 at PC 1).
- **Lowest Variance**: The "affirmative, negated, conjunctions, disjunctions" subplot (bottom-right) explains the least variance (~0.25 at PC 1).
- **German Variants**: Subplots involving German language features (bottom row) generally show lower explained variance compared to their non-German counterparts.
### Interpretation
The data suggests that simpler linguistic conditions (e.g., "affirmative") capture the largest fraction of variance in the dataset, likely reflecting dominant patterns in the activations. Adding negated terms, conjunctions, or disjunctions reduces explained variance, indicating these features introduce complexity or noise. The inclusion of German-specific variants further reduces explained variance, possibly due to language-specific idiosyncrasies or smaller sample sizes. The consistent decay across PCs across all subplots aligns with the typical behavior of principal component analysis, where early components capture the most significant structure in the data. This pattern underscores the importance of focusing on early PCs for modeling or interpretation tasks.