## Chart Type: Multiple Scatter Plots
### Overview
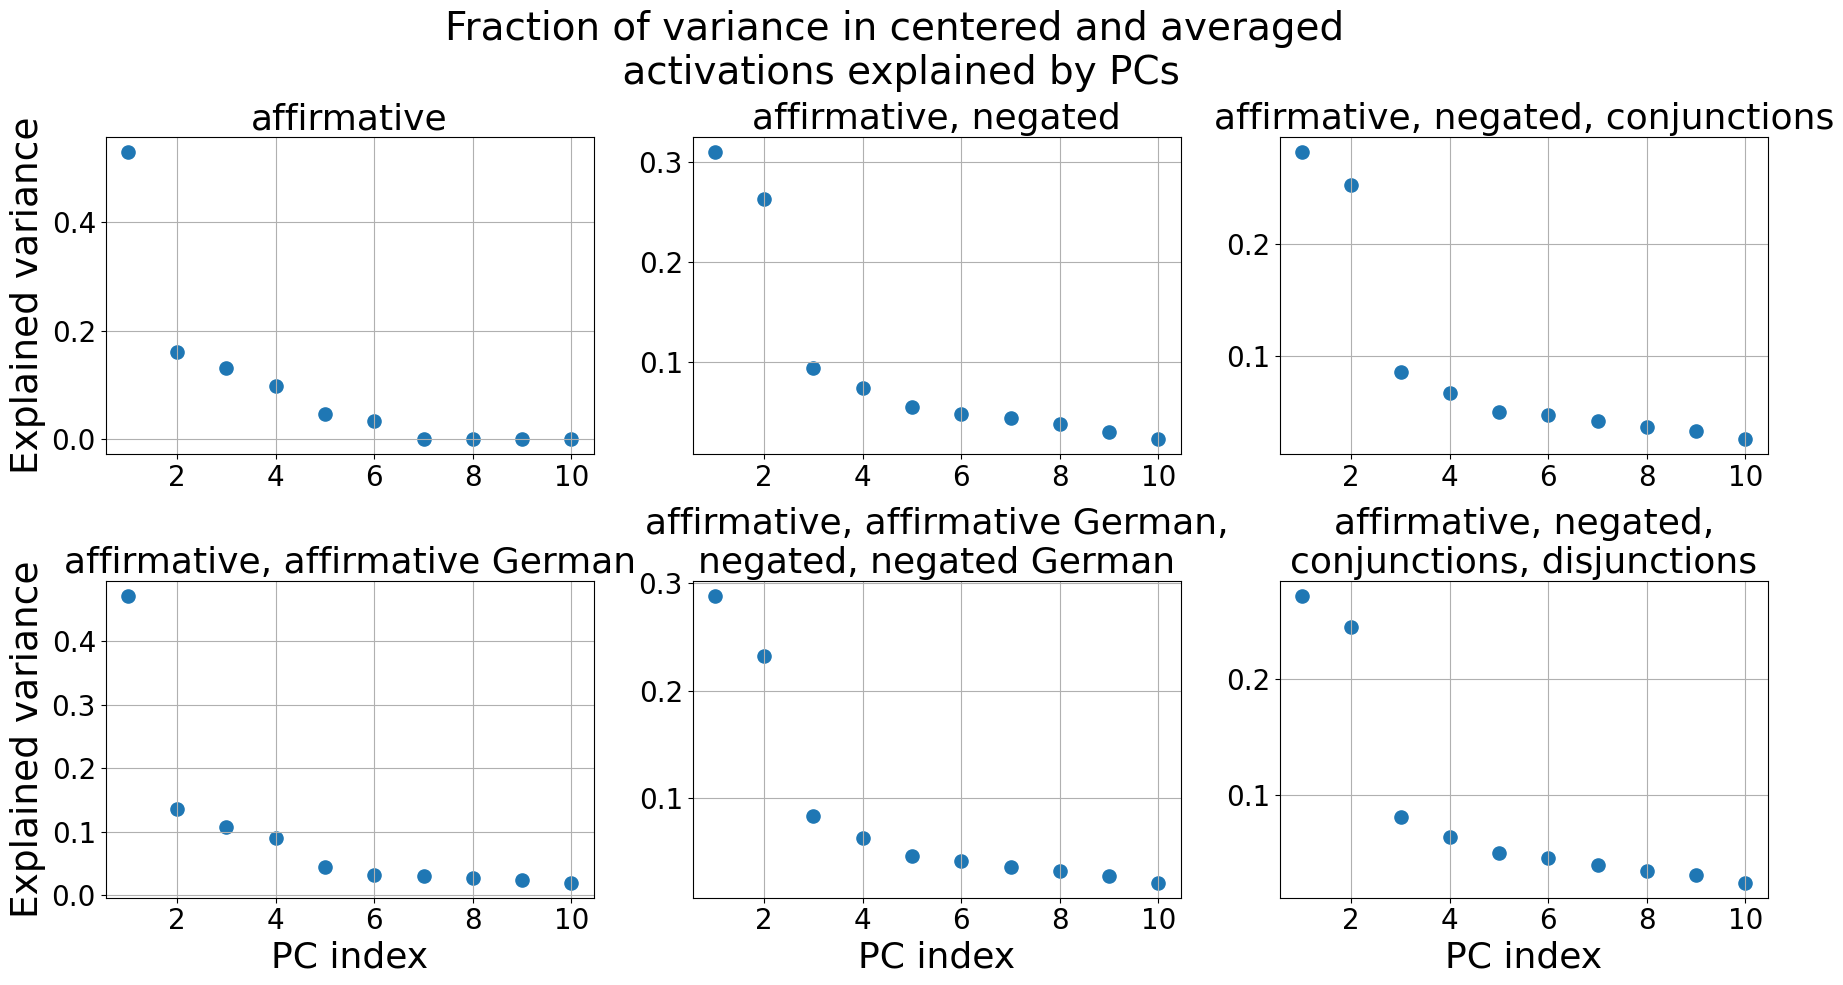
The image contains six scatter plots arranged in a 2x3 grid. Each plot shows the fraction of variance explained by principal components (PCs) for different sentence types. The x-axis represents the PC index (from 1 to 10), and the y-axis represents the explained variance. All plots exhibit a similar trend: a rapid decrease in explained variance for the first few PCs, followed by a gradual leveling off.
### Components/Axes
* **Title:** Fraction of variance in centered and averaged activations explained by PCs
* **X-axis:** PC index (values from 1 to 10)
* **Y-axis:** Explained variance (values from 0.0 to approximately 0.5, depending on the plot)
* **Plot Titles (Top Row):**
* affirmative
* affirmative, negated
* affirmative, negated, conjunctions
* **Plot Titles (Bottom Row):**
* affirmative, affirmative German
* affirmative, affirmative German, negated, negated German
* affirmative, negated, conjunctions, disjunctions
### Detailed Analysis
**Plot 1: affirmative**
* Trend: Explained variance decreases rapidly from PC 1 to PC 4, then levels off.
* Data Points:
* PC 1: ~0.48
* PC 2: ~0.16
* PC 3: ~0.13
* PC 4: ~0.10
* PC 6: ~0.03
* PC 8: ~0.00
* PC 10: ~0.00
**Plot 2: affirmative, negated**
* Trend: Explained variance decreases rapidly from PC 1 to PC 4, then levels off.
* Data Points:
* PC 1: ~0.28
* PC 2: ~0.09
* PC 3: ~0.07
* PC 4: ~0.06
* PC 6: ~0.05
* PC 8: ~0.04
* PC 10: ~0.03
**Plot 3: affirmative, negated, conjunctions**
* Trend: Explained variance decreases rapidly from PC 1 to PC 4, then levels off.
* Data Points:
* PC 1: ~0.24
* PC 2: ~0.07
* PC 3: ~0.05
* PC 4: ~0.04
* PC 6: ~0.03
* PC 8: ~0.03
* PC 10: ~0.02
**Plot 4: affirmative, affirmative German**
* Trend: Explained variance decreases rapidly from PC 1 to PC 4, then levels off.
* Data Points:
* PC 1: ~0.46
* PC 2: ~0.13
* PC 3: ~0.10
* PC 4: ~0.09
* PC 6: ~0.04
* PC 8: ~0.03
* PC 10: ~0.02
**Plot 5: affirmative, affirmative German, negated, negated German**
* Trend: Explained variance decreases rapidly from PC 1 to PC 4, then levels off.
* Data Points:
* PC 1: ~0.28
* PC 2: ~0.08
* PC 3: ~0.06
* PC 4: ~0.05
* PC 6: ~0.03
* PC 8: ~0.03
* PC 10: ~0.02
**Plot 6: affirmative, negated, conjunctions, disjunctions**
* Trend: Explained variance decreases rapidly from PC 1 to PC 4, then levels off.
* Data Points:
* PC 1: ~0.24
* PC 2: ~0.07
* PC 3: ~0.06
* PC 4: ~0.04
* PC 6: ~0.03
* PC 8: ~0.03
* PC 10: ~0.02
### Key Observations
* The first principal component (PC 1) consistently explains the largest fraction of variance across all sentence types.
* The explained variance decreases sharply for the first few PCs, indicating that these components capture the most significant patterns in the data.
* The plots for "affirmative" and "affirmative, affirmative German" start with a higher explained variance compared to the other plots.
* The plots with more complex sentence structures (e.g., "affirmative, negated, conjunctions, disjunctions") tend to have lower explained variance for the first PC compared to simpler sentence structures.
### Interpretation
The plots suggest that the initial principal components are effective at capturing the primary variance in the activations for all sentence types. The rapid decrease in explained variance indicates that the first few PCs are the most important for representing the data. The differences in initial explained variance between sentence types may reflect the complexity of the underlying linguistic structures and the corresponding neural activations. The "affirmative" and "affirmative, affirmative German" sentence types, having higher initial explained variance, might be considered less complex in terms of the neural representations they elicit. The addition of negation, conjunctions, and disjunctions appears to reduce the fraction of variance explained by the first PC, suggesting that these linguistic elements introduce more complex patterns in the neural activations.