## Scatter Plots: Fraction of Variance Explained by PCs
### Overview
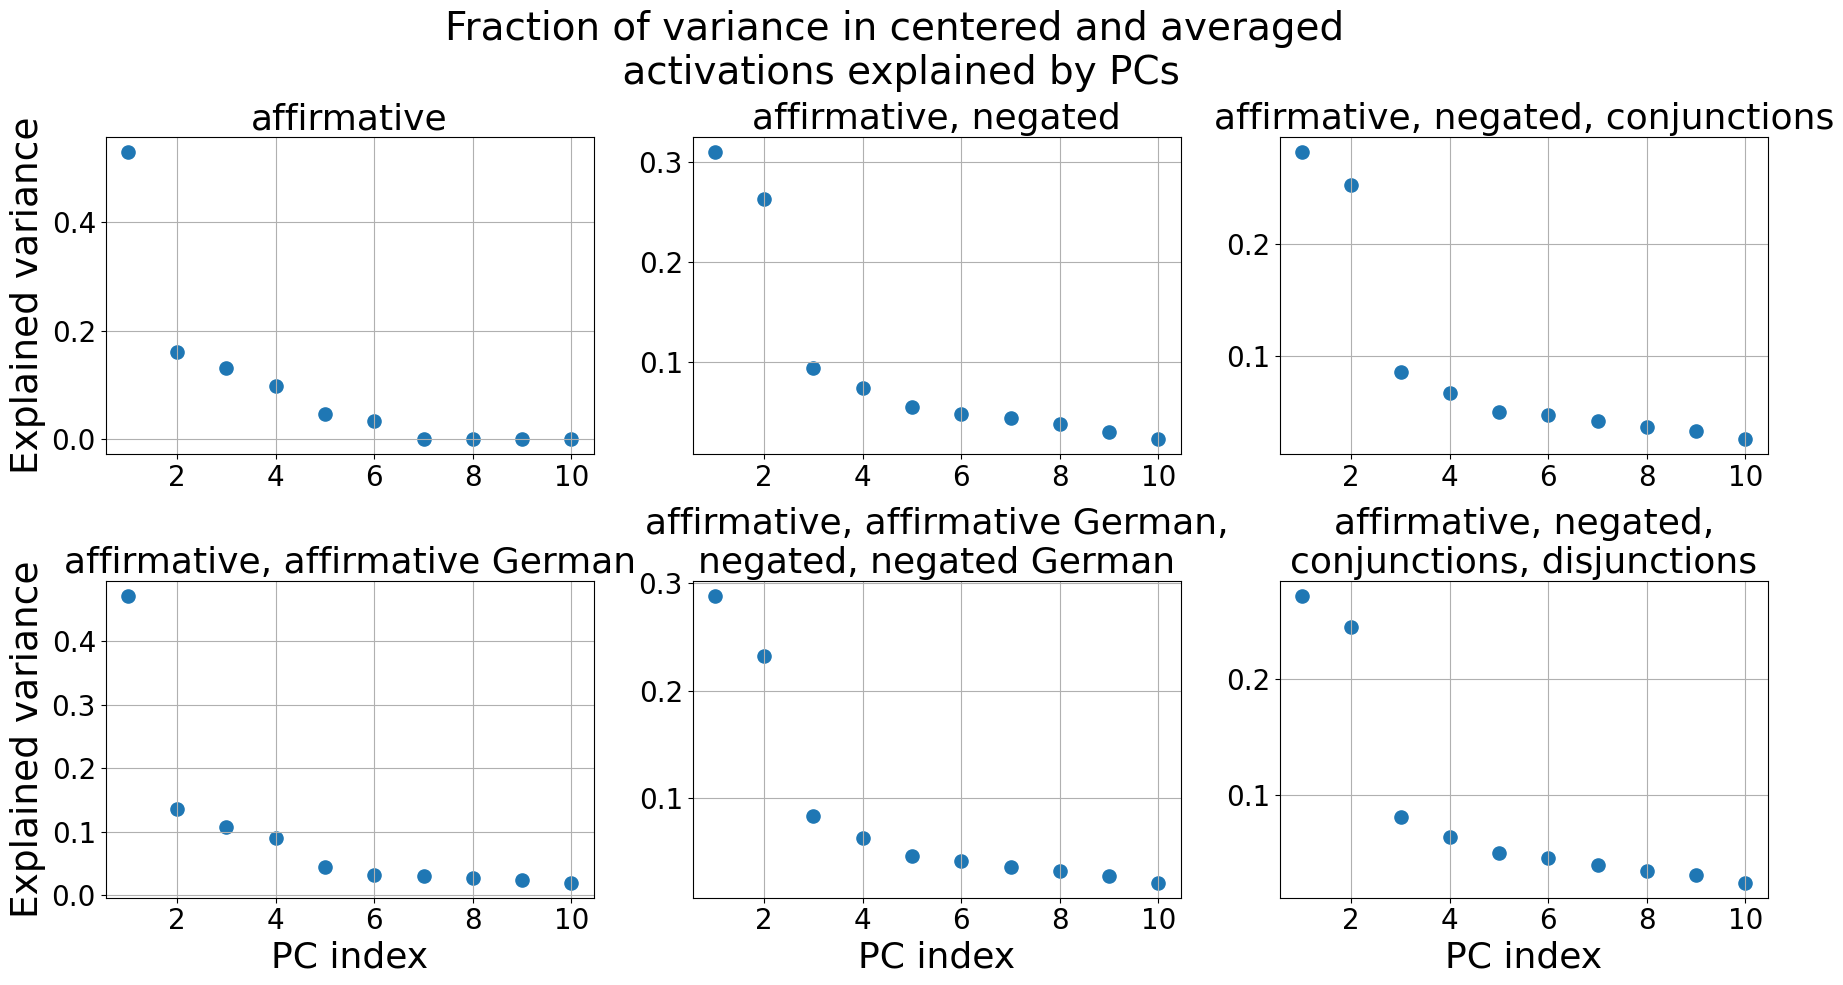
The image presents six scatter plots, each displaying the fraction of variance explained by Principal Components (PCs) for different linguistic conditions. The x-axis represents the PC index (ranging from 1 to 10), and the y-axis represents the explained variance (ranging from 0 to approximately 0.45). Each plot corresponds to a specific combination of linguistic features: affirmative, affirmative/negated, affirmative/negated/conjunctions, affirmative/affirmative German/negated, affirmative/affirmative German/negated German, and affirmative/negated/conjunctions/disjunctions.
### Components/Axes
* **Title:** "Fraction of variance in centered and averaged activations explained by PCs" (positioned at the top-center)
* **X-axis Label:** "PC index" (appears on all plots)
* **Y-axis Label:** "Explained variance" (appears on all plots)
* **Plots (6 total):**
1. "affirmative"
2. "affirmative, negated"
3. "affirmative, negated, conjunctions"
4. "affirmative, affirmative German, negated"
5. "affirmative, affirmative German, negated, negated German"
6. "affirmative, negated, conjunctions, disjunctions"
### Detailed Analysis
Each plot contains approximately 10 data points (scattered dots). The trend in each plot is a general decrease in explained variance as the PC index increases.
**Plot 1: "affirmative"**
* The data points generally decrease from left to right.
* PC Index 1: Explained Variance ≈ 0.42
* PC Index 2: Explained Variance ≈ 0.18
* PC Index 3: Explained Variance ≈ 0.12
* PC Index 4-10: Explained Variance ≈ 0.05 - 0.08
**Plot 2: "affirmative, negated"**
* The data points generally decrease from left to right.
* PC Index 1: Explained Variance ≈ 0.31
* PC Index 2: Explained Variance ≈ 0.25
* PC Index 3: Explained Variance ≈ 0.08
* PC Index 4-10: Explained Variance ≈ 0.04 - 0.06
**Plot 3: "affirmative, negated, conjunctions"**
* The data points generally decrease from left to right.
* PC Index 1: Explained Variance ≈ 0.30
* PC Index 2: Explained Variance ≈ 0.14
* PC Index 3-10: Explained Variance ≈ 0.06 - 0.08
**Plot 4: "affirmative, affirmative German, negated"**
* The data points generally decrease from left to right.
* PC Index 1: Explained Variance ≈ 0.43
* PC Index 2: Explained Variance ≈ 0.14
* PC Index 3: Explained Variance ≈ 0.08
* PC Index 4-10: Explained Variance ≈ 0.04 - 0.06
**Plot 5: "affirmative, affirmative German, negated, negated German"**
* The data points generally decrease from left to right.
* PC Index 1: Explained Variance ≈ 0.32
* PC Index 2: Explained Variance ≈ 0.22
* PC Index 3: Explained Variance ≈ 0.07
* PC Index 4-10: Explained Variance ≈ 0.04 - 0.06
**Plot 6: "affirmative, negated, conjunctions, disjunctions"**
* The data points generally decrease from left to right.
* PC Index 1: Explained Variance ≈ 0.31
* PC Index 2: Explained Variance ≈ 0.15
* PC Index 3-10: Explained Variance ≈ 0.06 - 0.08
### Key Observations
* The first PC (PC Index 1) consistently explains the largest fraction of variance across all conditions, ranging from approximately 0.30 to 0.43.
* The explained variance rapidly decreases after the first few PCs, suggesting that a relatively small number of PCs capture most of the variance in the data.
* The "affirmative, affirmative German, negated" condition shows the highest explained variance for the first PC.
* The plots are visually similar, all exhibiting a decreasing trend.
### Interpretation
The plots demonstrate how the fraction of variance explained by Principal Components differs across various linguistic conditions. The consistent decrease in explained variance as the PC index increases indicates that the data is effectively represented by a lower-dimensional space. The differences in explained variance between conditions suggest that the linguistic features (affirmative, negation, conjunctions, disjunctions, German) influence the underlying structure of the data. The higher explained variance for the first PC in most conditions suggests that the first PC captures the most prominent source of variation in the data. The fact that the plots are generally similar suggests that the underlying patterns are consistent across conditions, despite the differences in linguistic features. This could indicate that the core cognitive processes involved in processing these linguistic structures are similar, but that the specific features modulate the strength or nature of these processes.