TECHNICAL ASSET FINGERPRINT
ceae25ce53f90d051280c04f
Click to view fullscreen
Press ESC or click to close
FOUND IN PAPERS
EXPERT: healer-alpha-free VERSION 1
RUNTIME: free/openrouter/healer-alpha
INTEL_VERIFIED
\n
## Scree Plots: Fraction of Variance Explained by Principal Components (PCs)
### Overview
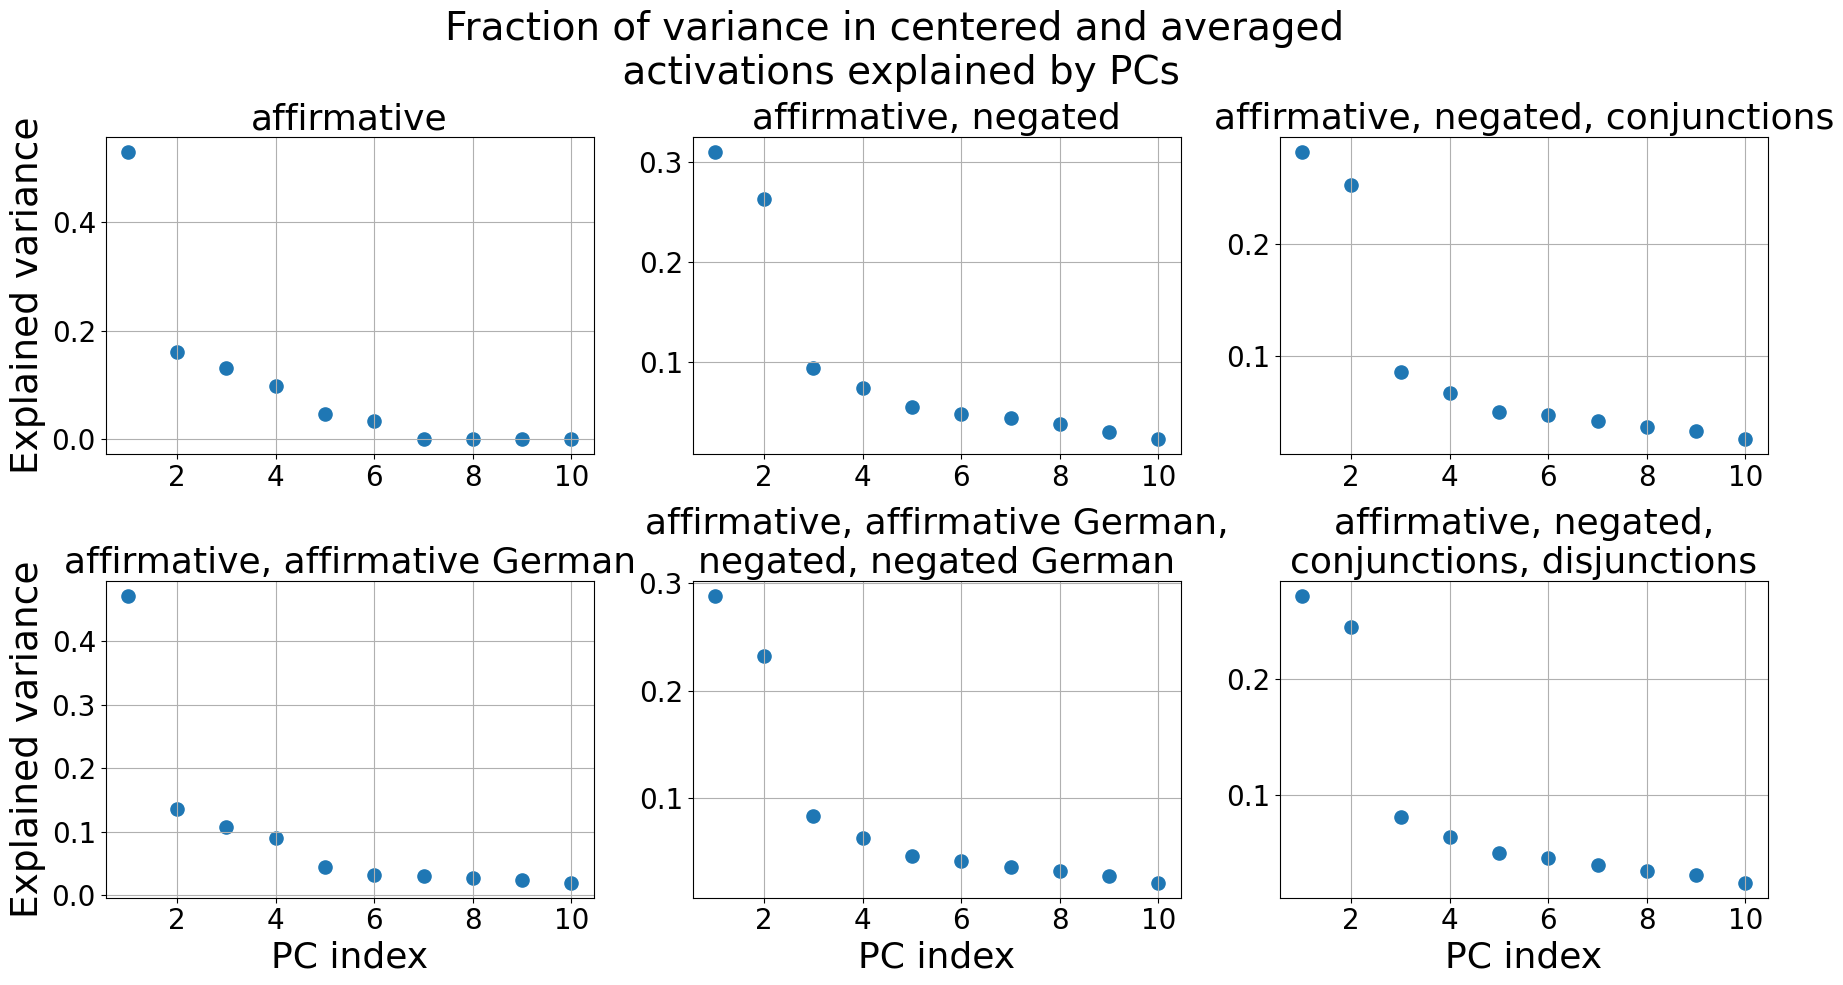
The image displays a 2x3 grid of six scatter plots (scree plots). Each plot shows the fraction of variance in "centered and averaged activations" explained by the first 10 principal components (PCs) for a different dataset or condition. The overall title is "Fraction of variance in centered and averaged activations explained by PCs". All plots share the same structure: the x-axis represents the PC index (1 through 10), and the y-axis represents the "Explained variance". Data points are plotted as blue circles.
### Components/Axes
* **Overall Title:** "Fraction of variance in centered and averaged activations explained by PCs"
* **X-axis (Common to all plots):** Label: "PC index". Ticks: 2, 4, 6, 8, 10. The axis spans from 1 to 10.
* **Y-axis (Common label, varying scales):** Label: "Explained variance". The scale differs for each subplot to accommodate the data range.
* **Subplot Titles (Defining the dataset/condition for each plot):**
1. Top-Left: "affirmative"
2. Top-Center: "affirmative, negated"
3. Top-Right: "affirmative, negated, conjunctions"
4. Bottom-Left: "affirmative, affirmative German"
5. Bottom-Center: "affirmative, affirmative German, negated, negated German"
6. Bottom-Right: "affirmative, negated, conjunctions, disjunctions"
* **Data Series:** Each plot contains a single data series represented by blue circles. There is no legend, as the title of each subplot defines the series.
### Detailed Analysis
**Trend Verification:** In all six plots, the explained variance is highest for PC1 and decreases monotonically for subsequent PCs, forming a characteristic "scree" shape. The drop from PC1 to PC2 is the most significant.
**Plot-by-Plot Data Point Extraction (Approximate Values):**
1. **Top-Left: "affirmative"**
* Y-axis scale: 0.0 to ~0.5.
* PC1: ~0.45
* PC2: ~0.16
* PC3: ~0.13
* PC4: ~0.10
* PC5: ~0.05
* PC6: ~0.03
* PCs 7-10: ~0.00 (near zero)
2. **Top-Center: "affirmative, negated"**
* Y-axis scale: 0.0 to ~0.32.
* PC1: ~0.31
* PC2: ~0.26
* PC3: ~0.095
* PC4: ~0.075
* PC5: ~0.06
* PC6: ~0.05
* PC7: ~0.045
* PC8: ~0.04
* PC9: ~0.03
* PC10: ~0.02
3. **Top-Right: "affirmative, negated, conjunctions"**
* Y-axis scale: 0.0 to ~0.25.
* PC1: ~0.25
* PC2: ~0.23
* PC3: ~0.09
* PC4: ~0.07
* PC5: ~0.06
* PC6: ~0.055
* PC7: ~0.05
* PC8: ~0.045
* PC9: ~0.04
* PC10: ~0.035
4. **Bottom-Left: "affirmative, affirmative German"**
* Y-axis scale: 0.0 to ~0.45.
* PC1: ~0.45
* PC2: ~0.14
* PC3: ~0.11
* PC4: ~0.09
* PC5: ~0.05
* PC6: ~0.035
* PC7: ~0.03
* PC8: ~0.025
* PC9: ~0.02
* PC10: ~0.015
5. **Bottom-Center: "affirmative, affirmative German, negated, negated German"**
* Y-axis scale: 0.0 to ~0.3.
* PC1: ~0.29
* PC2: ~0.23
* PC3: ~0.085
* PC4: ~0.065
* PC5: ~0.05
* PC6: ~0.045
* PC7: ~0.04
* PC8: ~0.035
* PC9: ~0.03
* PC10: ~0.02
6. **Bottom-Right: "affirmative, negated, conjunctions, disjunctions"**
* Y-axis scale: 0.0 to ~0.25.
* PC1: ~0.25
* PC2: ~0.23
* PC3: ~0.085
* PC4: ~0.065
* PC5: ~0.055
* PC6: ~0.05
* PC7: ~0.045
* PC8: ~0.04
* PC9: ~0.035
* PC10: ~0.03
### Key Observations
1. **Dominance of PC1:** The first principal component explains the largest fraction of variance in every case, ranging from ~0.25 to ~0.45.
2. **Impact of Dataset Complexity:** As more conditions are added to the dataset (moving from "affirmative" alone to combinations with negations, conjunctions, etc.), the variance explained by PC1 generally decreases, and the variance becomes more distributed across the first few PCs. For example, PC1 drops from ~0.45 ("affirmative") to ~0.25 ("affirmative, negated, conjunctions").
3. **Similarity in Structure:** The plots for "affirmative, negated, conjunctions" (top-right) and "affirmative, negated, conjunctions, disjunctions" (bottom-right) are nearly identical, suggesting adding "disjunctions" does not significantly alter the variance structure compared to the three-condition set.
4. **Cross-Lingual Consistency:** The plot for "affirmative, affirmative German" (bottom-left) closely resembles the "affirmative" plot (top-left), indicating that the variance structure is preserved across English and German for the same (affirmative) condition.
5. **Steep Initial Drop:** All plots show a sharp decline in explained variance from PC1 to PC2, followed by a more gradual decay. This is a classic pattern indicating that a few primary components capture most of the signal.
### Interpretation
This analysis investigates the underlying structure of neural activation patterns (likely from a language model) under different linguistic conditions. Principal Component Analysis (PCA) is used to find the directions (PCs) of maximum variance in the data.
* **What the data suggests:** The high variance explained by PC1 in the simple "affirmative" case suggests a strong, dominant pattern in the activations for affirmative statements. Adding negation ("affirmative, negated") significantly reduces PC1's dominance and increases the variance explained by PC2, indicating that negation introduces a major, distinct source of variation in the activation space.
* **Relationship between elements:** The plots demonstrate how the complexity of the linguistic input (affirmation, negation, logical connectives like conjunctions/disjunctions, and cross-lingual data) affects the dimensionality of the representation. More complex or varied inputs lead to a more distributed representation across multiple principal components.
* **Notable patterns/anomalies:** The near-identity of the last two plots is a key finding. It implies that, within this analysis, the activation patterns for "conjunctions" and "disjunctions" may be similar or that adding disjunctions does not introduce a new major axis of variation beyond what is already captured by the combination of affirmation, negation, and conjunctions. The strong similarity between the English-only and English-German affirmative plots suggests a language-invariant core representation for this simple condition.
DECODING INTELLIGENCE...