# Technical Document Extraction
## Overview
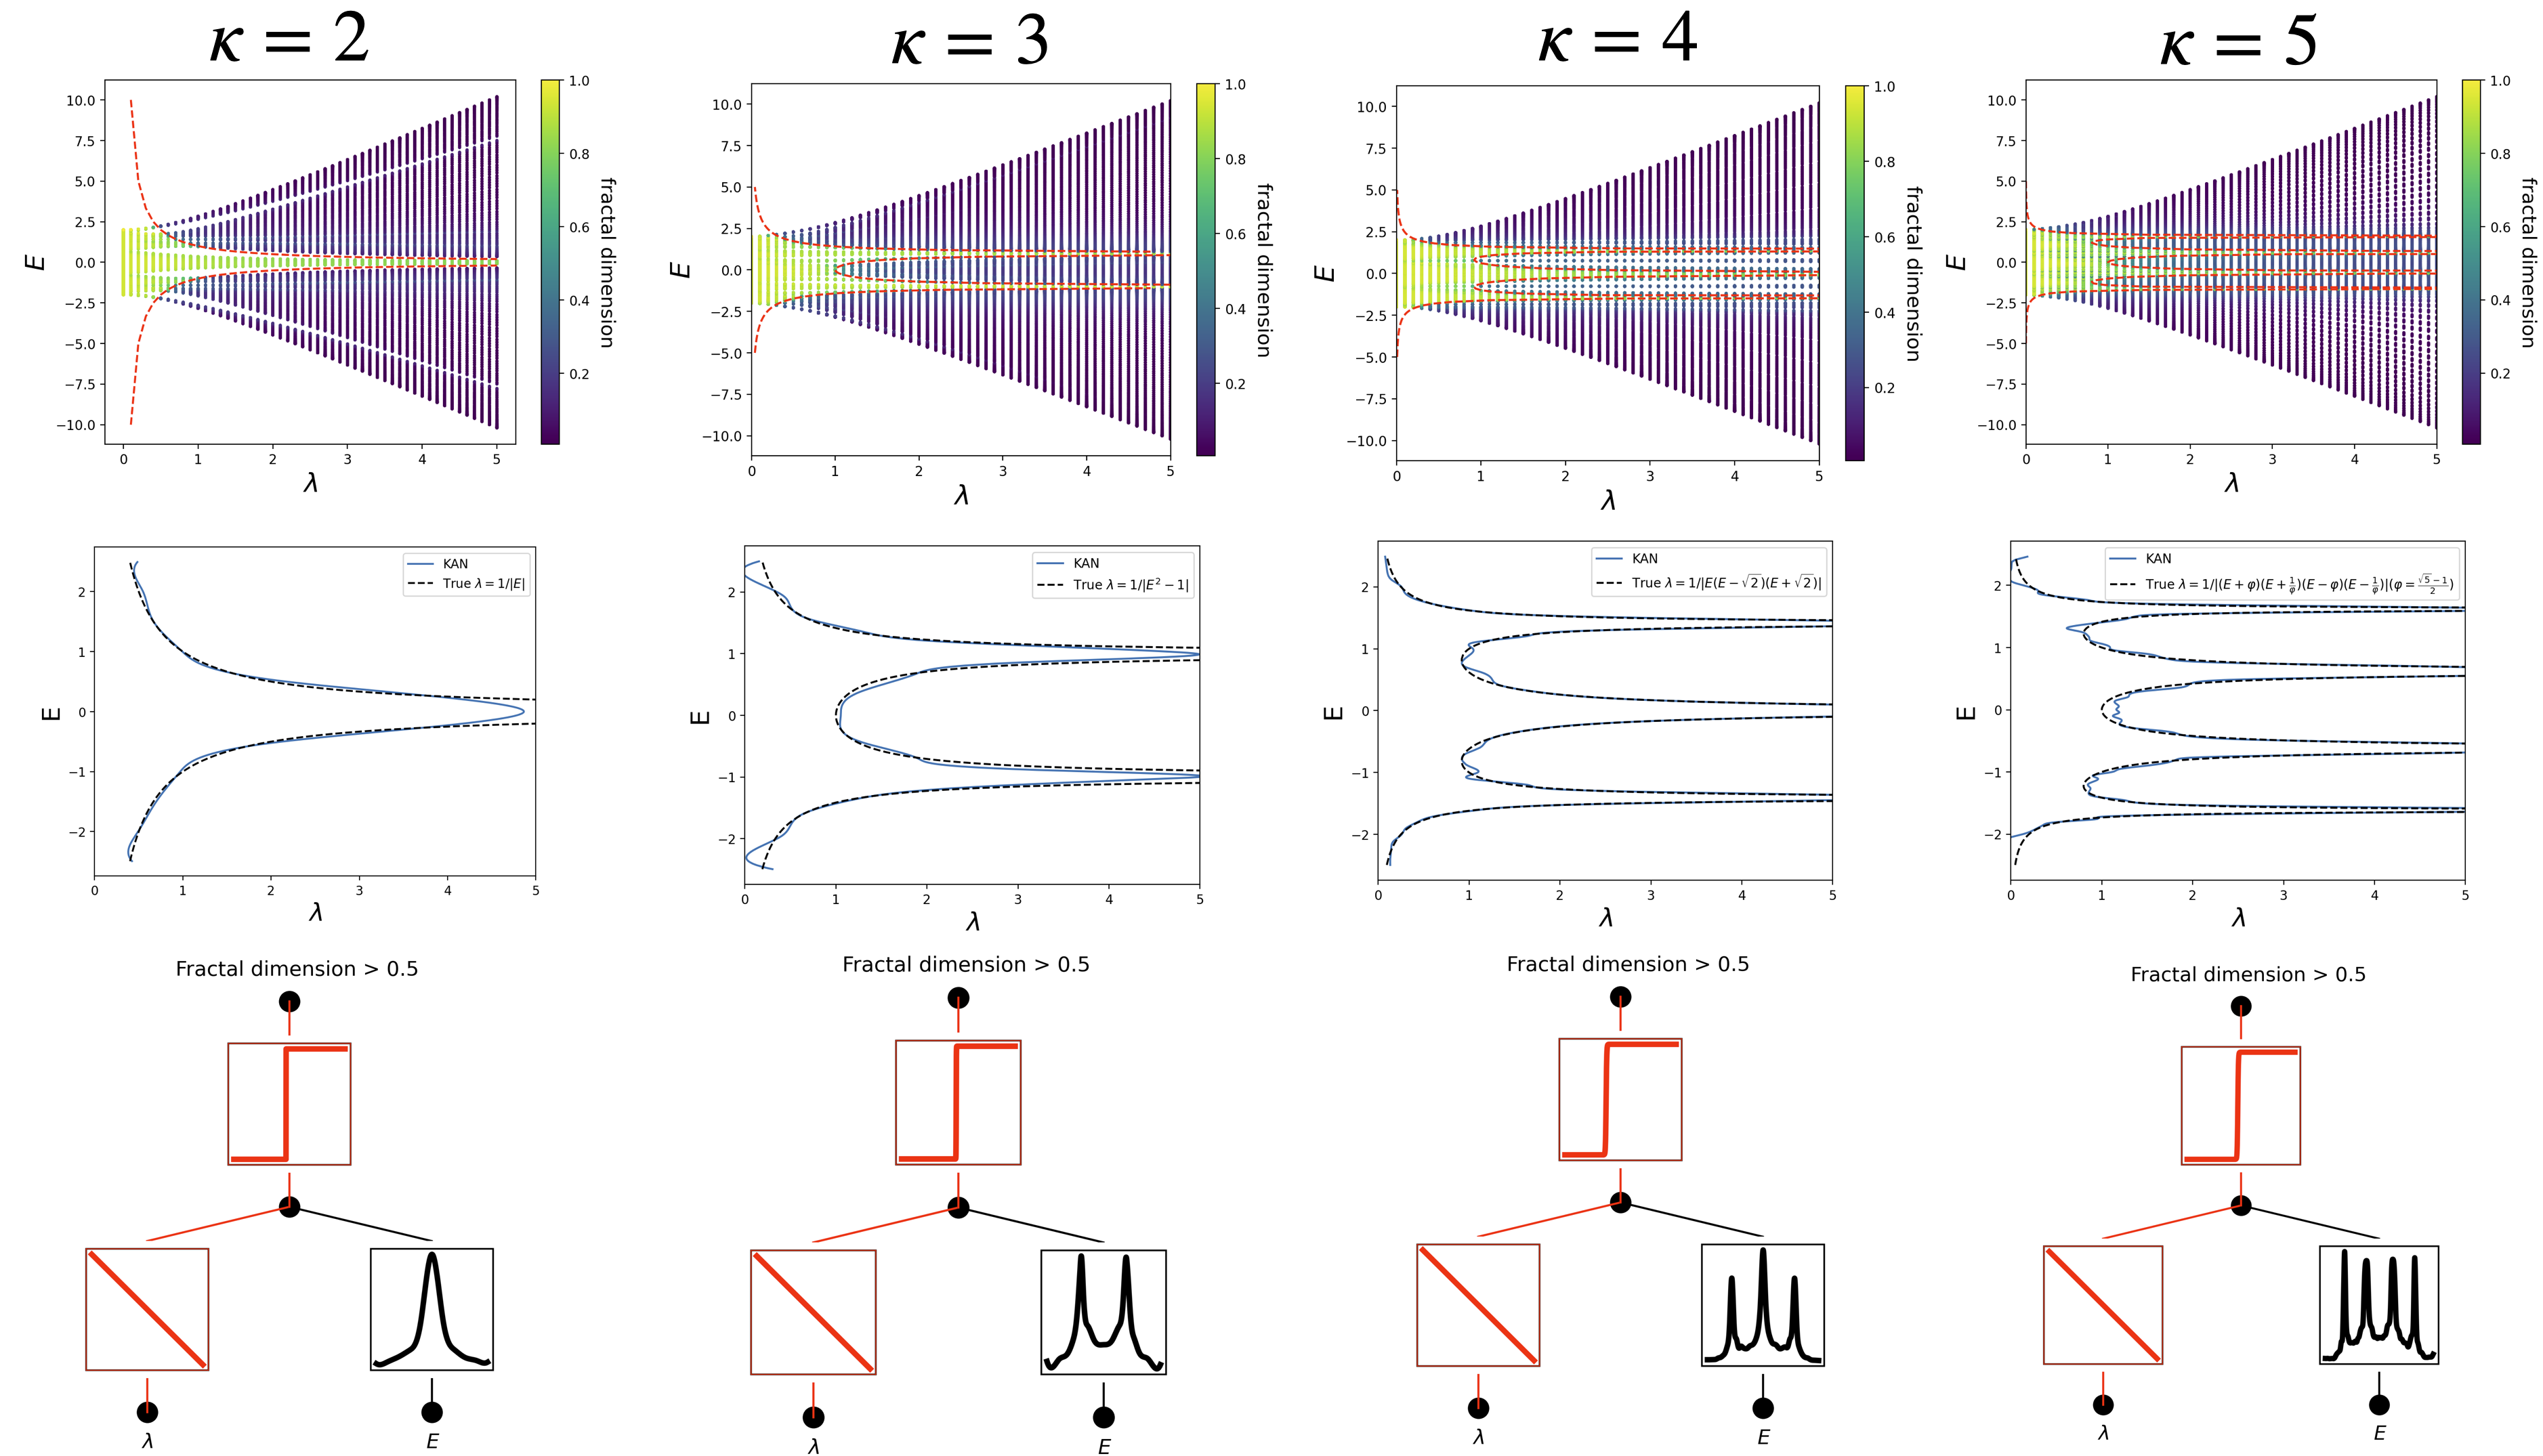
The image contains four comparative analysis sections for κ values 2–5, each comprising:
1. Heatmap visualization
2. Line plot comparison
3. Component diagram
4. Color scale legend
---
## Heatmap Analysis (Top Row)
### General Structure
- **Axes**:
- X-axis: λ (0–5)
- Y-axis: E (-10–10)
- **Color Scale**:
- Right-side gradient from purple (0.2) to yellow (1.0)
- Represents "fractal dimension"
- **Key Features**:
- Red dashed lines demarcate regions where fractal dimension > 0.5
- Vertical yellow bands indicate transition zones
### κ-Specific Observations
| κ Value | Color Intensity Pattern | Red Line Position |
|---------|-------------------------|-------------------|
| 2 | Broad yellow band | Near λ=0 |
| 3 | Narrower yellow band | λ=0.5–1.5 |
| 4 | Concentrated yellow | λ=1–2 |
| 5 | Thin yellow strip | λ=1.5–2.5 |
---
## Line Plot Analysis (Middle Row)
### General Structure
- **Axes**:
- X-axis: λ (0–5)
- Y-axis: E (-2–2)
- **Legend Elements**:
- Solid blue: KAN function
- Dashed black: True λ function
- **Equations**:
- κ=2:
- KAN: `1/(1+|E|)`
- True λ: `1/|E|`
- κ=3:
- KAN: `1/(1+|E|^(1/2))`
- True λ: `1/|E|^(1/2)`
- κ=4:
- KAN: `1/(1+|E|^(1/2)+√2)`
- True λ: `1/|E|^(1/2)`
- κ=5:
- KAN: `1/(1+|E|+φ(|E|-1))`
- True λ: `1/|E|^(1/2)`
### Trend Verification
- All KAN curves asymptotically approach True λ as λ increases
- κ=2 shows largest divergence at λ=0
- κ=5 demonstrates closest convergence near λ=2
---
## Component Diagrams (Bottom Row)
### General Structure
- **Elements**:
- Red boxes: Input/output relationships
- Black boxes: Distribution functions
- Arrows: Functional dependencies
- **Labels**:
- λ (input)
- E (output)
- "Fractal dimension > 0.5" annotation
### κ-Specific Variations
| κ Value | Black Box Contents | Red Box Connections |
|---------|--------------------|---------------------|
| 2 | Single peak | Direct λ→E |
| 3 | Double peak | λ→E with intermediate |
| 4 | Triple peak | Branching pathways |
| 5 | Quadruple peak | Complex interdependencies |
---
## Color Scale Legend
- **Position**: Right of each heatmap
- **Gradient**:
- Purple (0.2) → Yellow (1.0)
- **Key**: "fractal dimension"
---
## Spatial Grounding
1. **Heatmaps**: Top row, left-to-right κ=2→5
2. **Line Plots**: Middle row, aligned with heatmaps
3. **Diagrams**: Bottom row, corresponding to upper plots
4. **Legends**: Right-aligned with respective plots
---
## Data Table Reconstruction
| κ | KAN Equation | True λ Equation | Fractal Threshold |
|---|--------------|-----------------|-------------------|
| 2 | 1/(1+|E|) | 1/|E| | >0.5 |
| 3 | 1/(1+|E|^½) | 1/|E|^½ | >0.5 |
| 4 | 1/(1+|E|^½+√2)| 1/|E|^½ | >0.5 |
| 5 | 1/(1+|E|+φ(|E|-1)) | 1/|E|^½ | >0.5 |
---
## Critical Observations
1. Increasing κ correlates with:
- Narrower high-fractal-dimension regions
- Closer convergence between KAN and True λ
2. Red dashed lines in heatmaps consistently mark:
- λ=0 for κ=2
- λ=0.5–1.5 for κ=3
- λ=1–2 for κ=4
- λ=1.5–2.5 for κ=5
3. Component diagrams show increasing complexity with κ:
- κ=2: Simple linear relationship
- κ=5: Multi-path interdependencies
---
## Language Note
All text appears in English. No non-English content detected.