\n
## Line Chart: Accuracy vs. Thinking Compute
### Overview
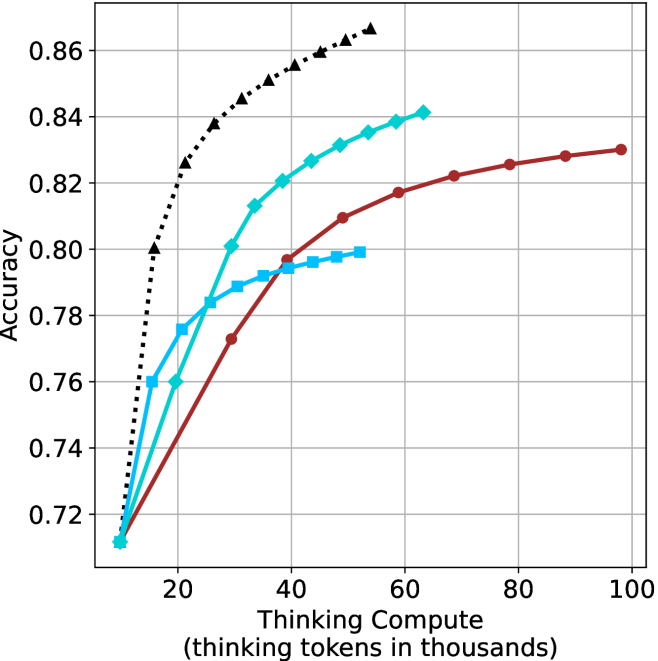
This image presents a line chart illustrating the relationship between "Thinking Compute" (measured in thousands of tokens) and "Accuracy". Four distinct data series are plotted, each represented by a different colored line. The chart demonstrates how accuracy changes as the amount of thinking compute increases.
### Components/Axes
* **X-axis:** "Thinking Compute (thinking tokens in thousands)". Scale ranges from approximately 0 to 100, with markers at 0, 20, 40, 60, 80, and 100.
* **Y-axis:** "Accuracy". Scale ranges from approximately 0.72 to 0.86, with markers at 0.72, 0.74, 0.76, 0.78, 0.80, 0.82, 0.84, and 0.86.
* **Data Series:** Four lines are present, each with a unique color:
* Black (dotted line)
* Cyan (solid line)
* Dark Turquoise (solid line)
* Maroon (solid line)
### Detailed Analysis
* **Black Line:** This line exhibits the steepest upward slope, indicating the fastest increase in accuracy with increasing thinking compute.
* At approximately 5 tokens, accuracy is around 0.74.
* At approximately 20 tokens, accuracy is around 0.82.
* At approximately 40 tokens, accuracy is around 0.85.
* Accuracy plateaus around 0.86 after 40 tokens.
* **Cyan Line:** This line shows a moderate upward slope, with a slower rate of increase compared to the black line.
* At approximately 5 tokens, accuracy is around 0.73.
* At approximately 20 tokens, accuracy is around 0.79.
* At approximately 40 tokens, accuracy is around 0.82.
* At approximately 60 tokens, accuracy is around 0.84.
* Accuracy plateaus around 0.84 after 60 tokens.
* **Dark Turquoise Line:** This line demonstrates a similar trend to the cyan line, but with slightly higher accuracy values.
* At approximately 5 tokens, accuracy is around 0.74.
* At approximately 20 tokens, accuracy is around 0.81.
* At approximately 40 tokens, accuracy is around 0.83.
* At approximately 60 tokens, accuracy is around 0.84.
* Accuracy plateaus around 0.84 after 60 tokens.
* **Maroon Line:** This line exhibits the slowest upward slope, indicating the smallest increase in accuracy with increasing thinking compute.
* At approximately 5 tokens, accuracy is around 0.72.
* At approximately 20 tokens, accuracy is around 0.77.
* At approximately 40 tokens, accuracy is around 0.80.
* At approximately 80 tokens, accuracy is around 0.83.
* Accuracy plateaus around 0.83 after 80 tokens.
### Key Observations
* The black line consistently outperforms the other lines in terms of accuracy, especially at lower thinking compute values.
* All lines demonstrate diminishing returns in accuracy as thinking compute increases. The rate of accuracy improvement slows down as the lines approach their plateaus.
* The maroon line consistently shows the lowest accuracy across all thinking compute values.
* The cyan and dark turquoise lines are very close in performance, with the dark turquoise line slightly outperforming the cyan line.
### Interpretation
The chart suggests that increasing "Thinking Compute" generally leads to improved "Accuracy", but the relationship is not linear. There's a point of diminishing returns where additional compute yields smaller and smaller gains in accuracy. The different lines likely represent different models or configurations, with the black line representing the most effective approach and the maroon line representing the least effective. The rapid initial gains in accuracy for all lines suggest that even a small amount of thinking compute can significantly improve performance. The plateaus indicate that other factors, beyond simply increasing compute, may become limiting factors in achieving higher accuracy. This data could be used to optimize resource allocation for AI systems, balancing the cost of compute with the desired level of accuracy.