## Line Graph: Accuracy vs. Thinking Compute
### Overview
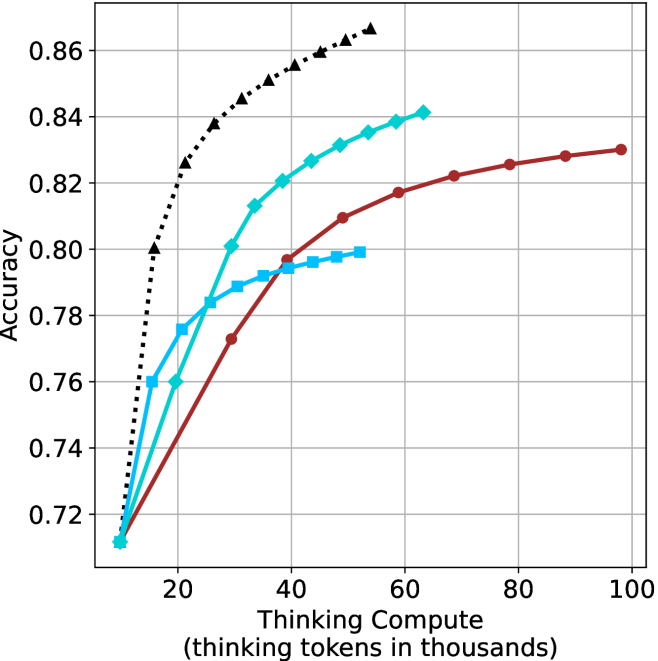
The image depicts a line graph comparing the accuracy of three computational models as a function of "Thinking Compute" (measured in thousands of thinking tokens). Three data series are represented by distinct markers and colors: black triangles, blue squares, and red circles. The graph shows a clear trend of increasing accuracy with higher compute, followed by plateauing performance at higher token thresholds.
### Components/Axes
- **X-axis**: "Thinking Compute (thinking tokens in thousands)"
- Scale: 0 to 100 (increments of 20)
- Position: Bottom of the graph
- **Y-axis**: "Accuracy"
- Scale: 0.72 to 0.86 (increments of 0.02)
- Position: Left side of the graph
- **Legend**: Located on the right side of the graph
- Black Triangles: Black line with triangular markers
- Blue Squares: Blue line with square markers
- Red Circles: Red line with circular markers
### Detailed Analysis
1. **Black Triangles (Black Line)**
- Starts at (0, 0.72) and rises sharply to (40, 0.86).
- Plateaus at ~0.85–0.86 from 40k to 100k tokens.
- Key data points:
- 20k tokens: ~0.78
- 40k tokens: ~0.86
- 60k tokens: ~0.85
- 80k tokens: ~0.85
- 100k tokens: ~0.85
2. **Red Circles (Red Line)**
- Starts at (0, 0.72) and rises gradually to (60, 0.83).
- Plateaus at ~0.83 from 60k to 100k tokens.
- Key data points:
- 20k tokens: ~0.76
- 40k tokens: ~0.81
- 60k tokens: ~0.83
- 80k tokens: ~0.83
- 100k tokens: ~0.83
3. **Blue Squares (Blue Line)**
- Starts at (0, 0.72) and rises to (40, 0.80).
- Plateaus at ~0.80 from 40k to 100k tokens.
- Key data points:
- 20k tokens: ~0.76
- 40k tokens: ~0.80
- 60k tokens: ~0.80
- 80k tokens: ~0.80
- 100k tokens: ~0.80
### Key Observations
- **Diminishing Returns**: All models exhibit plateauing accuracy after a certain compute threshold (40k–60k tokens).
- **Performance Hierarchy**:
- Black Triangles > Red Circles > Blue Squares in terms of accuracy.
- Black Triangles achieve the highest accuracy (~0.86) with the least compute (~40k tokens).
- **Efficiency Gaps**:
- Blue Squares require 20k more tokens than Black Triangles to reach 0.80 accuracy.
- Red Circles require 20k more tokens than Black Triangles to reach 0.83 accuracy.
### Interpretation
The graph demonstrates that computational efficiency significantly impacts model performance. The Black Triangles model achieves superior accuracy with minimal compute, suggesting it is the most optimized architecture. The Blue Squares model, while requiring the most compute, delivers the lowest accuracy, indicating potential inefficiencies in its design. The plateauing trends across all models imply that beyond a certain compute threshold, additional resources yield negligible accuracy improvements. This highlights the importance of optimizing model architecture over brute-force compute scaling. The data could inform resource allocation strategies in AI development, prioritizing models with higher efficiency-to-accuracy ratios.