## Line Chart: Performance Comparison of Transformers and DynTS
### Overview
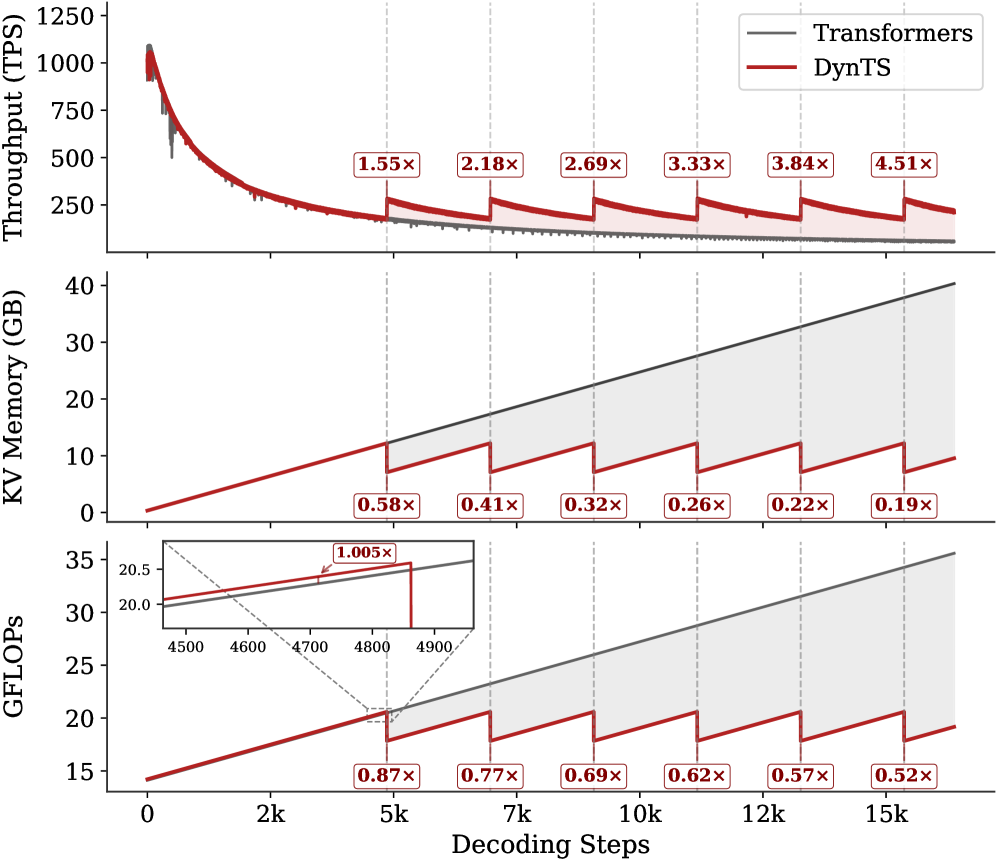
This image presents a comparative performance analysis of two models, "Transformers" and "DynTS", across three metrics: Throughput (TPS), KV Memory (GB), and GFLOPs. The performance is evaluated as a function of "Decoding Steps", ranging from 0 to 15k. Each metric is displayed in a separate subplot. The charts include multipliers indicating the relative change in performance between the two models at specific decoding step intervals.
### Components/Axes
* **X-axis (all subplots):** Decoding Steps (0k to 15k, with markers at 2k, 5k, 7k, 10k, 12k, and 15k).
* **Top Subplot (Throughput):**
* Y-axis: Throughput (TPS) - Scale from 0 to 1250.
* Legend (top-right):
* Black Line: Transformers
* Red Line: DynTS
* **Middle Subplot (KV Memory):**
* Y-axis: KV Memory (GB) - Scale from 0 to 40.
* Legend (top-right): Same as above.
* **Bottom Subplot (GFLOPs):**
* Y-axis: GFLOPs - Scale from 15 to 35. A zoomed-in inset chart is present, showing a smaller range (approximately 20 to 20.5).
* Legend (top-right): Same as above.
* **Multipliers:** Red boxes with text indicating the performance ratio (e.g., "1.55x", "0.58x").
### Detailed Analysis or Content Details
**Top Subplot (Throughput):**
* The black line (Transformers) starts at approximately 1100 TPS and rapidly declines to around 250 TPS at 15k decoding steps. The decline appears exponential.
* The red line (DynTS) starts at approximately 200 TPS and decreases more slowly, reaching around 230 TPS at 15k decoding steps. The decline is more linear.
* Multipliers:
* 2k: 1.55x
* 5k: 2.18x
* 7k: 2.69x
* 10k: 3.33x
* 12k: 3.84x
* 15k: 4.51x
**Middle Subplot (KV Memory):**
* The black line (Transformers) starts at approximately 2 GB and increases linearly to around 36 GB at 15k decoding steps.
* The red line (DynTS) starts at approximately 0 GB and increases linearly to around 6 GB at 15k decoding steps.
* Multipliers:
* 2k: 0.58x
* 5k: 0.41x
* 7k: 0.32x
* 10k: 0.26x
* 12k: 0.22x
* 15k: 0.19x
**Bottom Subplot (GFLOPs):**
* The black line (Transformers) starts at approximately 16 GFLOPs and increases to around 31 GFLOPs at 15k decoding steps. The increase is roughly linear.
* The red line (DynTS) starts at approximately 15 GFLOPs and increases to around 23 GFLOPs at 15k decoding steps. The increase is roughly linear.
* Inset Chart: Shows a zoomed-in view of the Transformers line between approximately 4500 and 4900 decoding steps, where the GFLOPs value ranges from 20.0 to 20.5.
* Multipliers:
* 2k: 0.87x
* 5k: 0.77x
* 7k: 0.69x
* 10k: 0.62x
* 12k: 0.57x
* 15k: 0.52x
### Key Observations
* DynTS consistently outperforms Transformers in terms of throughput as decoding steps increase. The multiplier values demonstrate a growing advantage for DynTS.
* DynTS uses significantly less KV memory than Transformers. The memory usage ratio decreases as decoding steps increase.
* Transformers requires more GFLOPs than DynTS, but the difference decreases as decoding steps increase.
* The inset chart in the GFLOPs subplot highlights a small range of values for Transformers, suggesting a relatively stable performance within that decoding step interval.
### Interpretation
The data suggests that DynTS is a more efficient model than Transformers, particularly for longer decoding sequences. While Transformers initially exhibits higher throughput, its performance degrades rapidly with increasing decoding steps, accompanied by a substantial increase in memory usage and computational cost (GFLOPs). DynTS, on the other hand, maintains a more stable throughput and requires significantly less memory, making it more scalable and practical for tasks involving long sequences. The increasing multipliers across all three metrics confirm this trend. The consistent decrease in the memory usage ratio (DynTS/Transformers) indicates that the memory efficiency advantage of DynTS becomes more pronounced as the decoding sequence length grows. The GFLOPs data suggests that DynTS achieves comparable performance with lower computational resources. This could be due to architectural differences or optimization techniques employed in DynTS. The inset chart in the GFLOPs subplot doesn't reveal any significant anomalies but provides a closer look at the Transformers' performance in a specific range.