## Line Chart: Performance Comparison of Transformers vs DynTS Across Decoding Steps
### Overview
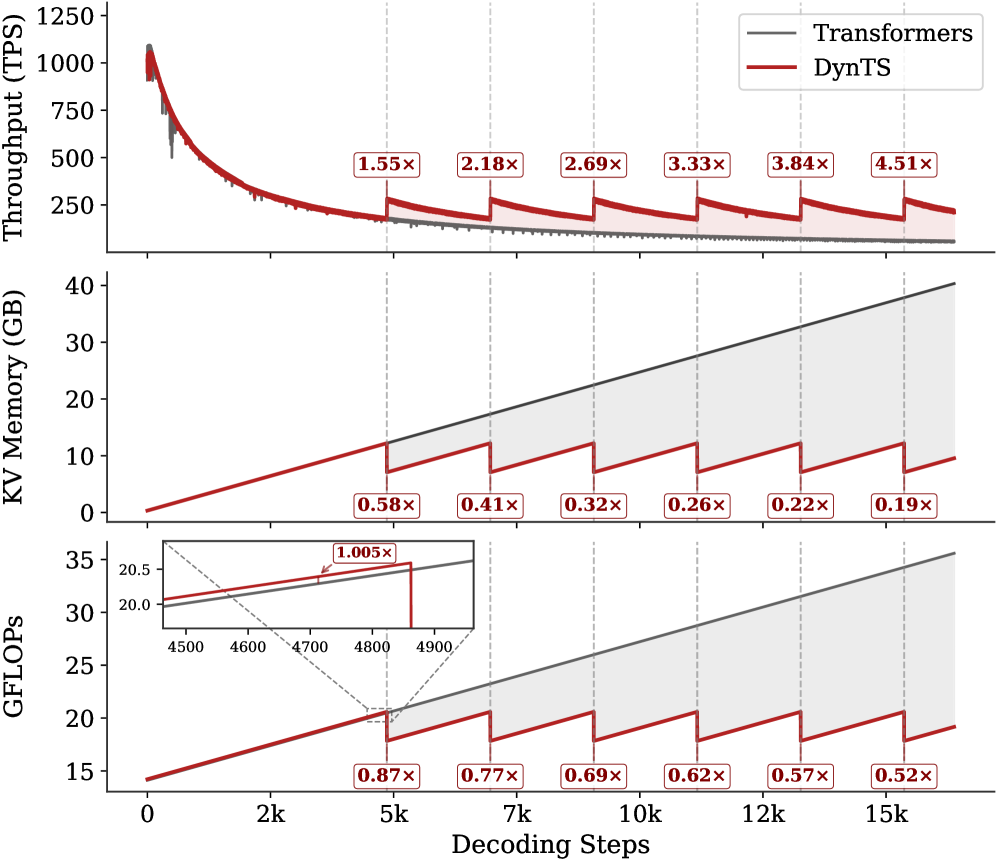
The image presents three vertically stacked line charts comparing the performance of two models (Transformers and DynTS) across three metrics: Throughput (TPS), KV Memory (GB), and GFLOPs. Each chart tracks performance as decoding steps increase from 0 to 15k, with vertical dashed lines marking key evaluation points (2k, 5k, 7k, 10k, 12k, 15k). The charts use a dual-color scheme (gray for Transformers, red for DynTS) with shaded confidence intervals.
### Components/Axes
1. **Top Subplot (Throughput)**:
- **Y-axis**: Throughput (TPS) from 0 to 1250
- **X-axis**: Decoding Steps (0 to 15k)
- **Legend**: Top-right corner (gray = Transformers, red = DynTS)
- **Annotations**: Multiplier labels (e.g., "1.55x") on DynTS line at key points
2. **Middle Subplot (KV Memory)**:
- **Y-axis**: KV Memory (GB) from 0 to 40
- **X-axis**: Decoding Steps (0 to 15k)
- **Legend**: Same as top subplot
- **Annotations**: Multiplier labels (e.g., "0.58x") on DynTS line
3. **Bottom Subplot (GFLOPs)**:
- **Y-axis**: GFLOPs from 15 to 35
- **X-axis**: Decoding Steps (0 to 15k)
- **Legend**: Same as above
- **Inset**: Zoomed view of 4500-4900 decoding steps with "1.005x" annotation
### Detailed Analysis
1. **Throughput (TPS)**:
- Transformers (gray) show a steep initial decline, stabilizing near 200 TPS after 2k steps.
- DynTS (red) maintains higher throughput, with multipliers increasing from 1.55x (2k steps) to 4.51x (15k steps).
- Confidence intervals (shaded areas) narrow as decoding steps increase.
2. **KV Memory (GB)**:
- Both models show linear growth, but DynTS consistently uses less memory.
- Multipliers decrease from 0.58x (2k steps) to 0.19x (15k steps), indicating DynTS's memory efficiency improves over time.
3. **GFLOPs**:
- Both models exhibit linear scaling, but DynTS maintains higher computational efficiency.
- Multipliers decrease from 0.87x (2k steps) to 0.52x (15k steps), suggesting diminishing returns for DynTS's efficiency advantage.
- Inset reveals near-parity at 4800 steps (1.005x multiplier).
### Key Observations
1. **Performance Trends**:
- DynTS consistently outperforms Transformers in throughput (x1.55–4.51) and computational efficiency (x0.52–0.87).
- DynTS demonstrates superior memory efficiency (x0.19–0.58), with the gap widening at higher decoding steps.
2. **Anomalies**:
- The GFLOPs multiplier approaches 1.0 at 4800 steps, suggesting potential convergence in computational efficiency at mid-range decoding.
- Throughput confidence intervals for DynTS narrow significantly after 7k steps, indicating stabilized performance.
3. **Spatial Patterns**:
- All subplots share the same x-axis scale, enabling direct comparison of decoding step impacts.
- Vertical dashed lines create visual alignment across subplots for key evaluation points.
### Interpretation
The data demonstrates that DynTS offers a **multiplicative performance advantage** over Transformers across all metrics, with the most significant gains in throughput (up to 4.51x) and memory efficiency (down to 0.19x). While computational efficiency (GFLOPs) shows diminishing returns (0.52x at 15k steps), DynTS maintains a consistent edge. The near-parity at 4800 steps in the GFLOPs inset suggests potential optimization opportunities for mid-range decoding scenarios. The widening performance gap at higher decoding steps implies DynTS scales more effectively for long-context tasks, making it preferable for applications requiring both speed and resource efficiency.