## Bar Chart: Prediction Flip Rate for Llama-3 Models
### Overview
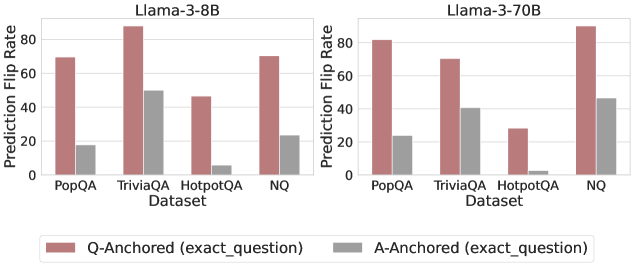
This image presents a comparative bar chart illustrating the Prediction Flip Rate for two Llama-3 models (8B and 70B) across four different datasets: PopQA, TriviaQA, HotpotQA, and NQ. The flip rate is measured on the Y-axis, while the datasets are displayed on the X-axis. Two bars are shown for each dataset, representing "Q-Anchored" and "A-Anchored" predictions.
### Components/Axes
* **Title (Left):** Llama-3-8B
* **Title (Right):** Llama-3-70B
* **X-axis Label:** Dataset
* **Y-axis Label:** Prediction Flip Rate
* **Legend:**
* Red Bar: Q-Anchored (exact_question)
* Gray Bar: A-Anchored (exact_question)
* **Datasets (X-axis):** PopQA, TriviaQA, HotpotQA, NQ
### Detailed Analysis
**Llama-3-8B (Left Chart)**
* **PopQA:**
* Q-Anchored: Approximately 68% (± 2%)
* A-Anchored: Approximately 24% (± 2%)
* **TriviaQA:**
* Q-Anchored: Approximately 92% (± 2%)
* A-Anchored: Approximately 52% (± 2%)
* **HotpotQA:**
* Q-Anchored: Approximately 46% (± 2%)
* A-Anchored: Approximately 8% (± 2%)
* **NQ:**
* Q-Anchored: Approximately 70% (± 2%)
* A-Anchored: Approximately 26% (± 2%)
**Llama-3-70B (Right Chart)**
* **PopQA:**
* Q-Anchored: Approximately 82% (± 2%)
* A-Anchored: Approximately 28% (± 2%)
* **TriviaQA:**
* Q-Anchored: Approximately 64% (± 2%)
* A-Anchored: Approximately 40% (± 2%)
* **HotpotQA:**
* Q-Anchored: Approximately 46% (± 2%)
* A-Anchored: Approximately 16% (± 2%)
* **NQ:**
* Q-Anchored: Approximately 88% (± 2%)
* A-Anchored: Approximately 44% (± 2%)
**Trends:**
* In both models, the Q-Anchored flip rate is consistently higher than the A-Anchored flip rate across all datasets.
* For the 8B model, TriviaQA shows the highest Q-Anchored flip rate.
* For the 70B model, NQ shows the highest Q-Anchored flip rate.
* HotpotQA consistently shows the lowest Q-Anchored flip rate for both models.
### Key Observations
* The 70B model generally exhibits higher Q-Anchored flip rates than the 8B model, particularly on PopQA and NQ.
* The difference between Q-Anchored and A-Anchored flip rates is substantial across all datasets, suggesting that anchoring the prediction to the question (Q-Anchored) leads to more frequent flips than anchoring to the answer (A-Anchored).
* The A-Anchored flip rates are relatively low across all datasets, indicating that the model is less likely to change its prediction when prompted with the answer.
### Interpretation
The data suggests that the Llama-3 models, particularly the larger 70B version, are sensitive to the way the prompt is constructed. Anchoring the prediction to the question itself (Q-Anchored) results in a significantly higher prediction flip rate compared to anchoring to the answer (A-Anchored). This implies that the models are more susceptible to subtle changes in the question phrasing or context.
The varying flip rates across different datasets may reflect the inherent difficulty and characteristics of each dataset. For example, TriviaQA, with its focus on factual knowledge, might be more prone to flips due to the model's uncertainty in recalling specific facts. HotpotQA, which requires multi-hop reasoning, might exhibit lower flip rates because the model needs to maintain consistency across multiple reasoning steps.
The higher performance of the 70B model suggests that increasing model size can improve robustness and reduce sensitivity to prompt variations, but the fundamental difference between Q-Anchored and A-Anchored flip rates remains consistent. This highlights the importance of careful prompt engineering and understanding the model's behavior when interpreting its predictions.