## Bar Charts: Prediction Flip Rates for Llama-3 Models
### Overview
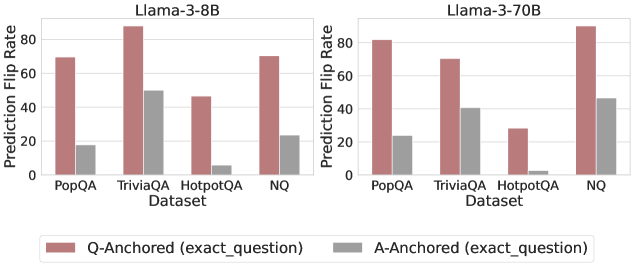
The image contains two side-by-side bar charts comparing the "Prediction Flip Rate" of two language models (Llama-3-8B and Llama-3-70B) across four question-answering datasets. The charts evaluate the stability of model predictions under two different anchoring conditions.
### Components/Axes
* **Chart Titles:** "Llama-3-8B" (left chart), "Llama-3-70B" (right chart).
* **Y-Axis (Both Charts):** Label is "Prediction Flip Rate". Scale ranges from 0 to 80, with major tick marks at 0, 20, 40, 60, and 80.
* **X-Axis (Both Charts):** Label is "Dataset". Categories are, from left to right: "PopQA", "TriviaQA", "HotpotQA", "NQ".
* **Legend:** Positioned at the bottom center of the entire image.
* **Red Bar:** "Q-Anchored (exact_question)"
* **Gray Bar:** "A-Anchored (exact_question)"
### Detailed Analysis
**Llama-3-8B Chart (Left):**
* **PopQA:** Q-Anchored (red) ≈ 70. A-Anchored (gray) ≈ 20.
* **TriviaQA:** Q-Anchored (red) ≈ 90 (exceeds the 80 axis mark). A-Anchored (gray) ≈ 50.
* **HotpotQA:** Q-Anchored (red) ≈ 45. A-Anchored (gray) ≈ 5.
* **NQ:** Q-Anchored (red) ≈ 70. A-Anchored (gray) ≈ 25.
**Llama-3-70B Chart (Right):**
* **PopQA:** Q-Anchored (red) ≈ 80. A-Anchored (gray) ≈ 25.
* **TriviaQA:** Q-Anchored (red) ≈ 70. A-Anchored (gray) ≈ 40.
* **HotpotQA:** Q-Anchored (red) ≈ 30. A-Anchored (gray) ≈ 3.
* **NQ:** Q-Anchored (red) ≈ 90 (exceeds the 80 axis mark). A-Anchored (gray) ≈ 45.
**Trend Verification:**
* In both models and across all four datasets, the **Q-Anchored (red) bar is consistently and significantly taller** than the corresponding A-Anchored (gray) bar.
* For the **Llama-3-8B model**, the highest flip rate is for TriviaQA (Q-Anchored), and the lowest is for HotpotQA (A-Anchored).
* For the **Llama-3-70B model**, the highest flip rate is for NQ (Q-Anchored), and the lowest is for HotpotQA (A-Anchored).
### Key Observations
1. **Dominant Pattern:** The anchoring method has a dramatic effect on prediction stability. Using the exact question as an anchor ("Q-Anchored") leads to a much higher rate of prediction flips compared to using the exact answer as an anchor ("A-Anchored").
2. **Dataset Sensitivity:** The "HotpotQA" dataset shows the lowest flip rates overall, especially for the A-Anchored condition, where the rate is near zero for both models. This suggests predictions on this dataset are more stable under answer anchoring.
3. **Model Scale Effect:** Comparing the two models, the larger Llama-3-70B shows a notably higher Q-Anchored flip rate for the "NQ" dataset (≈90 vs ≈70 for the 8B model) but a lower rate for "TriviaQA" (≈70 vs ≈90). The A-Anchored rates are generally similar or slightly higher for the 70B model.
### Interpretation
This data demonstrates a strong **anchoring bias** in the Llama-3 models' question-answering behavior. A "prediction flip" likely refers to the model changing its answer when presented with a slightly modified or rephrased query. The results show that when the model's reasoning is anchored to the specific phrasing of the question (Q-Anchored), its output is highly unstable and prone to flipping. Conversely, when anchored to a specific answer (A-Anchored), its predictions become far more consistent.
The variation across datasets (PopQA, TriviaQA, HotpotQA, NQ) indicates that the nature of the questions or the knowledge domain influences this stability. HotpotQA, which often involves multi-hop reasoning, appears to produce the most stable answers under answer anchoring. The difference between the 8B and 70B models suggests that model scale interacts with this bias, but not in a uniformly linear way—increasing scale amplifies the instability for some datasets (like NQ) while reducing it for others (like TriviaQA). This has practical implications for prompt engineering and the reliability of model outputs, highlighting that the way a query is framed can drastically alter the consistency of the response.