## Bar Chart: Prediction Flip Rate Comparison for Llama-3-8B and Llama-3-70B Models
### Overview
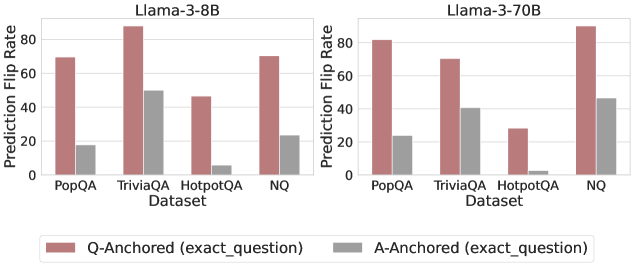
The image is a grouped bar chart comparing prediction flip rates for two language models (Llama-3-8B and Llama-3-70B) across four question-answering datasets (PopQA, TriviaQA, HotpotQA, NQ). Two anchoring strategies are compared: Q-Anchored (exact_question) and A-Anchored (exact_question), represented by red and gray bars respectively.
### Components/Axes
- **X-Axis (Datasets)**: PopQA, TriviaQA, HotpotQA, NQ (repeated for both models)
- **Y-Axis (Prediction Flip Rate)**: 0–80% scale
- **Legend**:
- Red = Q-Anchored (exact_question)
- Gray = A-Anchored (exact_question)
- **Model Labels**:
- Top-left: Llama-3-8B
- Top-right: Llama-3-70B
### Detailed Analysis
#### Llama-3-8B Section
- **Q-Anchored (red)**:
- PopQA: ~70%
- TriviaQA: ~85% (highest)
- HotpotQA: ~45%
- NQ: ~70%
- **A-Anchored (gray)**:
- PopQA: ~15%
- TriviaQA: ~50%
- HotpotQA: ~5%
- NQ: ~20%
#### Llama-3-70B Section
- **Q-Anchored (red)**:
- PopQA: ~80%
- TriviaQA: ~70%
- HotpotQA: ~25%
- NQ: ~85% (highest)
- **A-Anchored (gray)**:
- PopQA: ~20%
- TriviaQA: ~40%
- HotpotQA: ~2%
- NQ: ~45%
### Key Observations
1. **Q-Anchored Dominance**: Q-Anchored consistently outperforms A-Anchored across all datasets and models (e.g., Llama-3-70B NQ: 85% vs 45%).
2. **Model Size Impact**: Llama-3-70B shows significantly higher flip rates than Llama-3-8B, especially in NQ (85% vs 70% for Q-Anchored).
3. **Dataset Variability**:
- TriviaQA and NQ yield the highest Q-Anchored rates.
- HotpotQA has the lowest Q-Anchored rates (25% for Llama-3-70B).
4. **A-Anchored Performance**: A-Anchored rates are generally low (<50%), with HotpotQA near 0% for Llama-3-70B.
### Interpretation
The data demonstrates that **Q-Anchored (exact_question)** anchoring strategies produce substantially higher prediction flip rates than A-Anchored (exact_answer) across both model sizes. This suggests that grounding predictions to exact questions improves model reliability. The Llama-3-70B model amplifies this effect, particularly in the NQ dataset, where Q-Anchored achieves 85% flip rate. Conversely, A-Anchored struggles with HotpotQA (near 0% for Llama-3-70B), likely due to answer variability in open-ended datasets. The trend highlights the importance of question-specific anchoring for robust QA performance, with larger models better leveraging this strategy.