## Chart: Transparency Issues Reported Over Time
### Overview
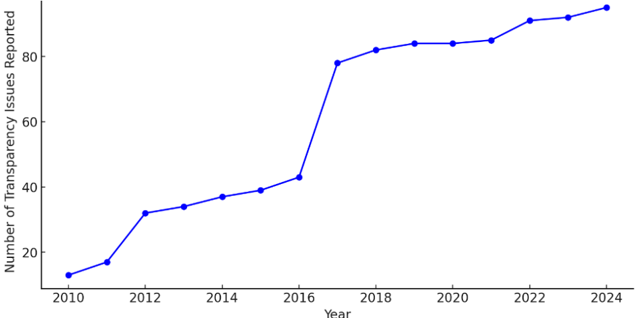
The image is a line chart showing the number of transparency issues reported over the years from 2010 to 2024. The chart shows a general upward trend, with a significant increase around 2017.
### Components/Axes
* **X-axis:** Year, ranging from 2010 to 2024 in increments of 2 years.
* **Y-axis:** Number of Transparency Issues Reported, ranging from 0 to 100.
* **Data Series:** A single blue line representing the number of transparency issues reported each year.
### Detailed Analysis
The blue line represents the number of transparency issues reported. The trend is generally upward, but with varying rates of increase.
* **2010:** Approximately 13 issues reported.
* **2012:** Approximately 32 issues reported.
* **2014:** Approximately 36 issues reported.
* **2016:** Approximately 43 issues reported.
* **2018:** Approximately 79 issues reported.
* **2020:** Approximately 84 issues reported.
* **2022:** Approximately 86 issues reported.
* **2024:** Approximately 90 issues reported.
### Key Observations
* There is a significant jump in the number of reported issues between 2016 and 2018.
* The rate of increase appears to slow down after 2018.
### Interpretation
The chart suggests that the number of reported transparency issues has generally increased over time. The sharp increase around 2017-2018 could be due to a change in reporting practices, increased awareness, or a genuine increase in the number of issues. The slowing rate of increase after 2018 might indicate that the initial factors driving the increase have stabilized, or that efforts to address transparency issues are having some effect.