## Line Chart: Transparency Issues Reported (2010-2024)
### Overview
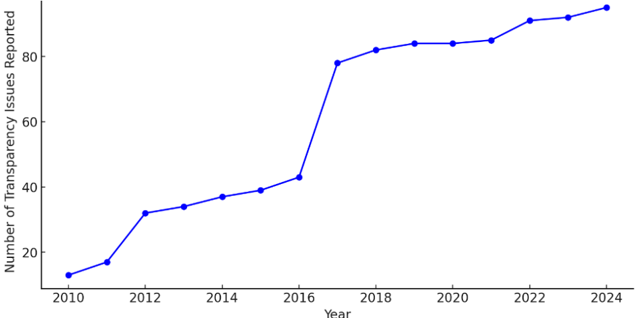
The image is a line chart displaying the annual count of reported transparency issues over a 15-year period from 2010 to 2024. The chart shows a general upward trend with a notable period of rapid increase followed by a plateau.
### Components/Axes
* **Chart Type:** Single-series line chart.
* **X-Axis (Horizontal):** Labeled "Year". It displays years from 2010 to 2024, with major tick marks and labels every two years (2010, 2012, 2014, 2016, 2018, 2020, 2022, 2024).
* **Y-Axis (Vertical):** Labeled "Number of Transparency Issues Reported". The scale runs from 0 to approximately 90, with labeled increments at 0, 20, 40, 60, and 80.
* **Data Series:** A single blue line with circular markers at each annual data point. There is no legend, as there is only one data series.
* **Visual Style:** The chart has a white background with a simple, clean layout. The line is a solid, medium blue.
### Detailed Analysis
**Data Points (Approximate Values):**
The following values are estimated based on the position of the blue markers relative to the y-axis scale.
* **2010:** ~12
* **2011:** ~16
* **2012:** ~32
* **2013:** ~34
* **2014:** ~37
* **2015:** ~39
* **2016:** ~43
* **2017:** ~78 (Sharp, significant increase)
* **2018:** ~82
* **2019:** ~84
* **2020:** ~84
* **2021:** ~85
* **2022:** ~91
* **2023:** ~92
* **2024:** ~95
**Trend Verification:**
1. **2010-2016 (Pre-Spike):** The line shows a steady, moderate upward slope. The number of issues grows from ~12 to ~43 over six years.
2. **2016-2017 (Spike):** The line exhibits a near-vertical, dramatic upward slope, indicating a massive year-over-year increase from ~43 to ~78.
3. **2017-2024 (Plateau/High-Level Growth):** The line's slope flattens considerably. It shows a gentle, sustained upward trend, rising from ~78 to ~95 over seven years, with a period of near-stagnation between 2019 and 2021.
### Key Observations
1. **The 2017 Anomaly:** The most striking feature is the discontinuity between 2016 and 2017, where the reported issues nearly doubled in a single year. This represents a clear break from the previous trend.
2. **Two Distinct Phases:** The data can be segmented into two primary phases: a period of gradual growth (2010-2016) and a period of high-volume, slower growth (2017-2024).
3. **Sustained High Volume:** After the 2017 spike, the number of reported issues never returns to pre-2017 levels and continues to climb, albeit slowly.
4. **Consistent Reporting:** The presence of a data point for every single year from 2010 to 2024 suggests consistent annual tracking and reporting of these issues.
### Interpretation
The data suggests a significant shift in the landscape of transparency reporting around 2017. The sharp increase could be attributed to several potential factors: the implementation of new regulations mandating disclosure, the adoption of more rigorous internal auditing standards, a major scandal that brought issues to light, or the creation of new, more accessible reporting channels.
The subsequent plateau at a high level indicates that the factors causing the 2017 spike were not temporary. Transparency issues remain a persistent and growing concern, with the count continuing to rise slowly year-on-year. This pattern implies that while awareness or reporting mechanisms may have dramatically improved or changed in 2017, the underlying problems have not been resolved and may even be increasing in frequency. The chart demonstrates a move from sporadic or lower-level reporting to a state of sustained, high-volume scrutiny.