## Line Graph: Number of Transparency Issues Reported (2010–2024)
### Overview
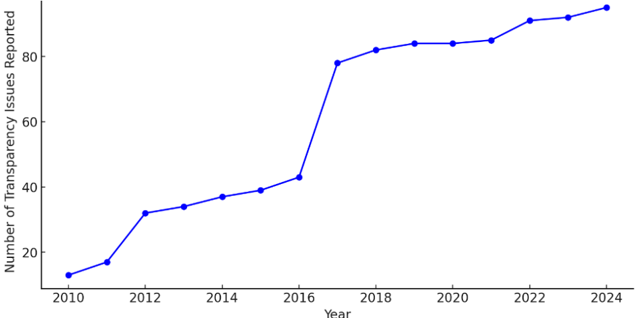
The image depicts a line graph illustrating the trend of transparency issues reported over a 14-year period (2010–2024). The y-axis represents the "Number of Transparency Issues Reported," while the x-axis represents the "Year." A single blue line connects data points across the timeline, showing a general upward trend with notable fluctuations.
---
### Components/Axes
- **X-Axis (Horizontal)**:
- Label: "Year"
- Scale: Discrete markers at 2010, 2012, 2014, 2016, 2018, 2020, 2022, and 2024.
- Positioning: Bottom of the graph, centered below the axis.
- **Y-Axis (Vertical)**:
- Label: "Number of Transparency Issues Reported"
- Scale: Incremental values from 0 to 100 in steps of 20 (0, 20, 40, 60, 80, 100).
- Positioning: Left side of the graph, aligned vertically.
- **Legend**:
- Label: "Number of Transparency Issues Reported"
- Color: Blue (matches the line graph).
- Positioning: Top-right corner of the graph.
---
### Detailed Analysis
- **Data Points**:
- **2010**: ~10 issues reported.
- **2012**: ~30 issues reported.
- **2014**: ~38 issues reported.
- **2016**: ~42 issues reported.
- **2017**: Sharp increase to ~78 issues reported.
- **2018**: ~82 issues reported.
- **2019**: ~84 issues reported.
- **2020**: ~84 issues reported.
- **2021**: ~86 issues reported.
- **2022**: ~92 issues reported.
- **2023**: ~94 issues reported.
- **2024**: ~98 issues reported.
- **Trends**:
- **2010–2016**: Gradual increase from ~10 to ~42 issues.
- **2017**: Abrupt spike to ~78 issues, followed by stabilization (~82–84 issues) from 2018–2020.
- **2021–2024**: Steeper rise from ~86 to ~98 issues.
---
### Key Observations
1. **Initial Growth (2010–2016)**: A consistent but modest rise in reported issues, suggesting gradual awareness or policy changes.
2. **2017 Spike**: A significant jump (~78 issues) followed by stabilization, potentially indicating a policy shift, increased scrutiny, or improved reporting mechanisms.
3. **Post-2020 Acceleration**: A sharp upward trend (from ~86 to ~98 issues) suggests renewed focus on transparency, possibly due to regulatory changes, public pressure, or technological advancements in reporting.
4. **Plateau (2018–2020)**: A period of stagnation (~82–84 issues) may reflect stabilized reporting standards or reduced new issues.
---
### Interpretation
The data suggests a long-term trend of increasing transparency issues reported, with two distinct phases of acceleration (2017 and 2021–2024). The 2017 spike could correlate with global events (e.g., anti-corruption campaigns) or institutional reforms. The post-2020 acceleration may reflect heightened accountability measures, digitalization of reporting systems, or increased public demand for transparency. The plateau between 2018–2020 might indicate a saturation point or reduced new issues during that period.
The graph underscores the importance of transparency as a growing concern, with potential implications for governance, corporate accountability, and public trust. Further analysis could explore external factors (e.g., legislation, technological tools) driving these trends.