## Line Charts: Incremental Class Learning Performance Comparison
### Overview
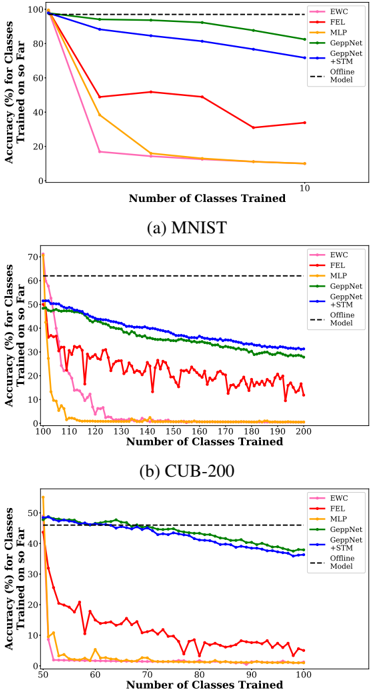
The image contains three line charts comparing the performance of six different machine learning methods on incremental class learning tasks. Each chart tracks the accuracy of models as they are sequentially trained on an increasing number of classes. The charts are labeled (a) MNIST, (b) CUB-200, and (c) ImageNet, representing three different datasets of increasing complexity.
### Components/Axes
* **Chart Type:** Three separate line charts arranged vertically.
* **X-Axis (All Charts):** "Number of Classes Trained". The scale varies per chart.
* (a) MNIST: 0 to 10 classes.
* (b) CUB-200: 100 to 200 classes.
* (c) ImageNet: 50 to 100 classes.
* **Y-Axis (All Charts):** "Accuracy (%) for Classes Trained so Far". The scale varies per chart.
* (a) MNIST: 0% to 100%.
* (b) CUB-200: 0% to 70%.
* (c) ImageNet: 0% to 50%.
* **Legend (Top-Right of each chart):** A consistent legend is present in all three charts, identifying six methods by color and line style:
* **EWC:** Pink line.
* **FEL:** Red line.
* **MLP:** Orange line.
* **GeppNet:** Green line.
* **GeppNet+STM:** Blue line.
* **Offline Model:** Black dashed horizontal line (baseline).
### Detailed Analysis
#### **Chart (a) MNIST**
* **Trend Verification:**
* **Offline Model (Black Dashed):** Constant horizontal line at ~98% accuracy.
* **GeppNet+STM (Blue):** Starts near 98%, slopes gently downward to ~80% at 10 classes.
* **GeppNet (Green):** Starts near 98%, slopes gently downward to ~85% at 10 classes.
* **FEL (Red):** Starts near 98%, drops sharply to ~50% at 3 classes, then fluctuates between ~30-50%, ending at ~35%.
* **MLP (Orange):** Starts near 98%, drops sharply to ~40% at 3 classes, then declines steadily to ~10%.
* **EWC (Pink):** Starts near 98%, drops very sharply to ~18% at 3 classes, then declines slowly to ~10%.
* **Data Points (Approximate):**
* At 1 class: All methods start at ~98%.
* At 3 classes: GeppNet/GeppNet+STM ~95%; FEL ~50%; MLP ~40%; EWC ~18%.
* At 10 classes: GeppNet ~85%; GeppNet+STM ~80%; FEL ~35%; MLP ~10%; EWC ~10%.
#### **Chart (b) CUB-200**
* **Trend Verification:**
* **Offline Model (Black Dashed):** Constant horizontal line at ~63% accuracy.
* **GeppNet+STM (Blue):** Starts at ~50%, slopes steadily downward to ~30% at 200 classes.
* **GeppNet (Green):** Starts at ~50%, slopes steadily downward to ~28% at 200 classes.
* **FEL (Red):** Starts at ~45%, drops sharply with high volatility, fluctuating between ~10-30%, ending at ~12%.
* **EWC (Pink):** Starts at ~60%, drops sharply to near 0% by 130 classes.
* **MLP (Orange):** Starts at ~40%, drops sharply to near 0% by 115 classes.
* **Data Points (Approximate):**
* At 100 classes: Offline ~63%; GeppNet/GeppNet+STM ~50%; FEL ~45%; EWC ~60%; MLP ~40%.
* At 150 classes: GeppNet+STM ~38%; GeppNet ~35%; FEL ~20%; EWC ~2%; MLP ~0%.
* At 200 classes: GeppNet+STM ~30%; GeppNet ~28%; FEL ~12%; EWC ~0%; MLP ~0%.
#### **Chart (c) ImageNet**
* **Trend Verification:**
* **Offline Model (Black Dashed):** Constant horizontal line at ~48% accuracy.
* **GeppNet+STM (Blue):** Starts at ~48%, slopes steadily downward to ~35% at 100 classes.
* **GeppNet (Green):** Starts at ~48%, slopes steadily downward to ~38% at 100 classes.
* **FEL (Red):** Starts at ~45%, drops sharply to ~15% by 60 classes, then fluctuates between ~5-15%, ending at ~5%.
* **MLP (Orange):** Starts at ~10%, drops to near 0% by 60 classes.
* **EWC (Pink):** Not visibly plotted (likely overlaps with MLP near 0%).
* **Data Points (Approximate):**
* At 50 classes: Offline ~48%; GeppNet/GeppNet+STM ~48%; FEL ~45%; MLP ~10%.
* At 75 classes: GeppNet+STM ~42%; GeppNet ~43%; FEL ~10%; MLP ~0%.
* At 100 classes: GeppNet ~38%; GeppNet+STM ~35%; FEL ~5%; MLP ~0%.
### Key Observations
1. **Performance Hierarchy:** Across all datasets, `GeppNet` and `GeppNet+STM` consistently outperform the other incremental methods (`FEL`, `EWC`, `MLP`), maintaining accuracy much closer to the `Offline Model` baseline.
2. **Catastrophic Forgetting:** `MLP` and `EWC` suffer severe catastrophic forgetting, with accuracy dropping to near zero as more classes are learned, especially on the more complex CUB-200 and ImageNet datasets.
3. **Dataset Complexity Impact:** As dataset complexity increases (MNIST -> CUB-200 -> ImageNet), the absolute accuracy of all methods decreases, and the performance gap between the best incremental methods (`GeppNet*`) and the offline baseline widens.
4. **FEL Volatility:** The `FEL` method shows high volatility in its performance, particularly on CUB-200, suggesting instability during the incremental learning process.
5. **GeppNet+STM vs. GeppNet:** The addition of STM (Short-Term Memory) to GeppNet provides a mixed benefit. It slightly hurts performance on MNIST and ImageNet but offers a small improvement on the more fine-grained CUB-200 dataset.
### Interpretation
These charts demonstrate the challenge of **catastrophic forgetting** in continual learning systems. The data suggests that specialized methods like `GeppNet` and its variant are significantly more effective at retaining knowledge of previously learned classes while incorporating new ones compared to simpler baselines (`MLP`) or other regularization-based approaches (`EWC`, `FEL`).
The consistent downward slope of even the best methods indicates that perfect knowledge retention is not achieved; there is a trade-off between plasticity (learning new classes) and stability (remembering old ones). The widening gap between the incremental methods and the offline upper bound as datasets become more complex highlights that this trade-off becomes more severe with task difficulty. The `FEL` method's erratic performance may indicate sensitivity to the order or nature of incoming data batches. This analysis is crucial for selecting algorithms in real-world applications where data arrives sequentially and retraining from scratch on all data is infeasible.