## Line Graphs: Model Accuracy vs. Number of Classes Trained
### Overview
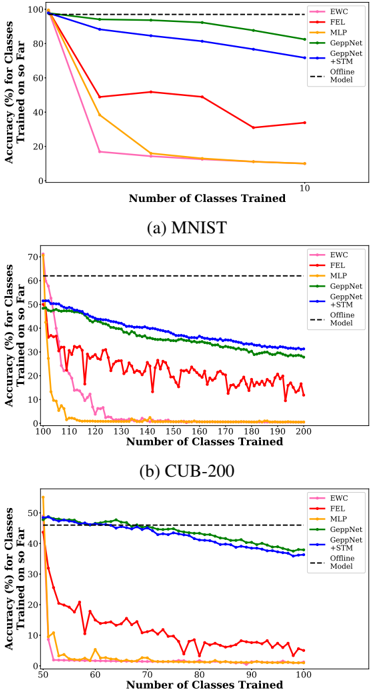
The image contains two line graphs comparing the accuracy of incremental class training models on two datasets: MNIST (handwritten digits) and CUB-200 (bird species). Each graph tracks accuracy (%) for classes trained on so far as the number of classes trained increases. The graphs include six models: EWC, FEL, MLP, GeppNet, +STM, and Offline Model (baseline).
### Components/Axes
- **X-axis**: "Number of Classes Trained" (ranges from 0 to 200 for CUB-200, 0 to 10 for MNIST).
- **Y-axis**: "Accuracy (%) for Classes Trained on so Far" (0% to 100% for MNIST, 0% to 70% for CUB-200).
- **Legends**:
- **Colors**:
- Pink: EWC
- Red: FEL
- Orange: MLP
- Green: GeppNet
- Blue: +STM
- Black dashed line: Offline Model (baseline).
- **Dashed Lines**:
- MNIST: 100% accuracy (Offline Model baseline).
- CUB-200: 70% accuracy (Offline Model baseline).
### Detailed Analysis
#### (a) MNIST Dataset
- **Trends**:
- **EWC (pink)**: Sharp decline from ~100% to ~10% after 10 classes.
- **FEL (red)**: Gradual decline from ~100% to ~40% after 10 classes.
- **MLP (orange)**: Steep drop to ~20% after 5 classes, then plateaus.
- **GeppNet (green)**: Smooth decline from ~100% to ~80% after 10 classes.
- **+STM (blue)**: Slowest decline, maintaining ~70% accuracy after 10 classes.
- **Offline Model (black dashed)**: Constant at 100%.
#### (b) CUB-200 Dataset
- **Trends**:
- **EWC (pink)**: Rapid drop to ~10% after 50 classes, then stabilizes.
- **FEL (red)**: Erratic fluctuations (10–30%) after 50 classes.
- **MLP (orange)**: Sharp decline to ~5% after 50 classes, then plateaus.
- **GeppNet (green)**: Gradual decline from ~50% to ~30% after 100 classes.
- **+STM (blue)**: Steady decline from ~50% to ~35% after 100 classes.
- **Offline Model (black dashed)**: Constant at 70%.
### Key Observations
1. **Baseline Performance**:
- MNIST’s offline model achieves 100% accuracy (perfect for digit classification).
- CUB-200’s offline model achieves 70% accuracy (reflecting dataset complexity).
2. **Model Performance**:
- **+STM** consistently outperforms other models in both datasets, retaining higher accuracy as classes increase.
- **FEL** shows erratic behavior in CUB-200, suggesting instability with complex data.
- **MLP** performs poorly in CUB-200, dropping below 10% accuracy after 50 classes.
3. **Dataset Complexity**:
- CUB-200’s lower baseline (70% vs. 100%) and noisier trends indicate higher intra-class variability compared to MNIST.
### Interpretation
- **Incremental Training Challenges**: All models degrade in accuracy as more classes are added, highlighting the difficulty of catastrophic forgetting.
- **Model Robustness**:
- **+STM**’s slower decline suggests better memory retention for prior classes.
- **GeppNet**’s smoother curves in MNIST indicate stability, while its sharper drop in CUB-200 reflects dataset-specific limitations.
- **Practical Implications**:
- For simple tasks (MNIST), even basic models like MLP can perform well initially but fail with scale.
- For complex tasks (CUB-200), specialized models like +STM are critical for maintaining performance.
- **Anomalies**:
- FEL’s erratic behavior in CUB-200 may indicate overfitting or sensitivity to class distribution.
- MLP’s rapid decline in CUB-200 underscores its unsuitability for high-dimensional, variable data.
This analysis demonstrates that model architecture and dataset complexity jointly determine incremental learning success. +STM and GeppNet emerge as strong candidates for real-world applications requiring continuous learning.