## Line Chart: Model Performance Comparison
### Overview
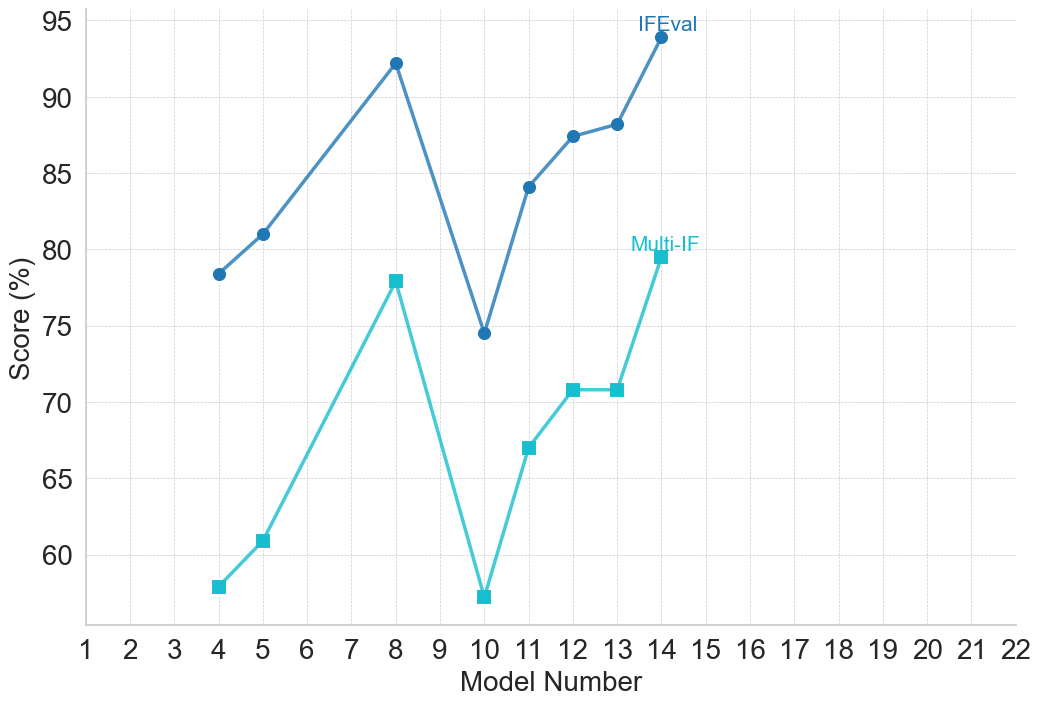
The image is a line chart comparing the performance of two models, "IFEval" and "Multi-IF," across a range of model numbers. The chart displays the score (in percentage) on the y-axis against the model number on the x-axis.
### Components/Axes
* **X-axis:** "Model Number" ranging from 1 to 22, with tick marks at each integer value.
* **Y-axis:** "Score (%)" ranging from 60 to 95, with tick marks at intervals of 5.
* **Legend:**
* "IFEval" is represented by a dark blue line with circular markers.
* "Multi-IF" is represented by a light blue line with square markers.
### Detailed Analysis
* **IFEval (Dark Blue Line):**
* **Trend:** Generally increasing with fluctuations.
* **Data Points:**
* Model 4: Approximately 78.7%
* Model 5: Approximately 81.1%
* Model 8: Approximately 92.3%
* Model 10: Approximately 74.6%
* Model 11: Approximately 84.1%
* Model 12: Approximately 87.4%
* Model 13: Approximately 88.2%
* Model 14: Approximately 93.5%
* **Multi-IF (Light Blue Line):**
* **Trend:** More volatile, with significant ups and downs.
* **Data Points:**
* Model 4: Approximately 58.1%
* Model 5: Approximately 60.7%
* Model 8: Approximately 78.2%
* Model 10: Approximately 57.5%
* Model 11: Approximately 66.8%
* Model 12: Approximately 70.8%
* Model 13: Approximately 70.8%
* Model 14: Approximately 80.0%
### Key Observations
* IFEval consistently outperforms Multi-IF, except for a brief period around Model 8.
* IFEval shows a generally increasing trend, suggesting improvements in performance as the model number increases.
* Multi-IF exhibits more significant fluctuations, indicating greater variability in performance across different model numbers.
### Interpretation
The chart provides a comparative analysis of the performance of two models, IFEval and Multi-IF, across a range of model numbers. The data suggests that IFEval generally performs better than Multi-IF, with a more consistent and upward trend. Multi-IF, on the other hand, shows more variability in performance. This could indicate that IFEval is a more robust and reliable model compared to Multi-IF. The fluctuations in Multi-IF's performance might be due to its sensitivity to specific model configurations or data characteristics. Further investigation into the specific differences between the models and their training data would be necessary to understand the reasons for these performance variations.