## Line Chart: Model Evaluation Scores (IFEval vs. Multi-IF)
### Overview
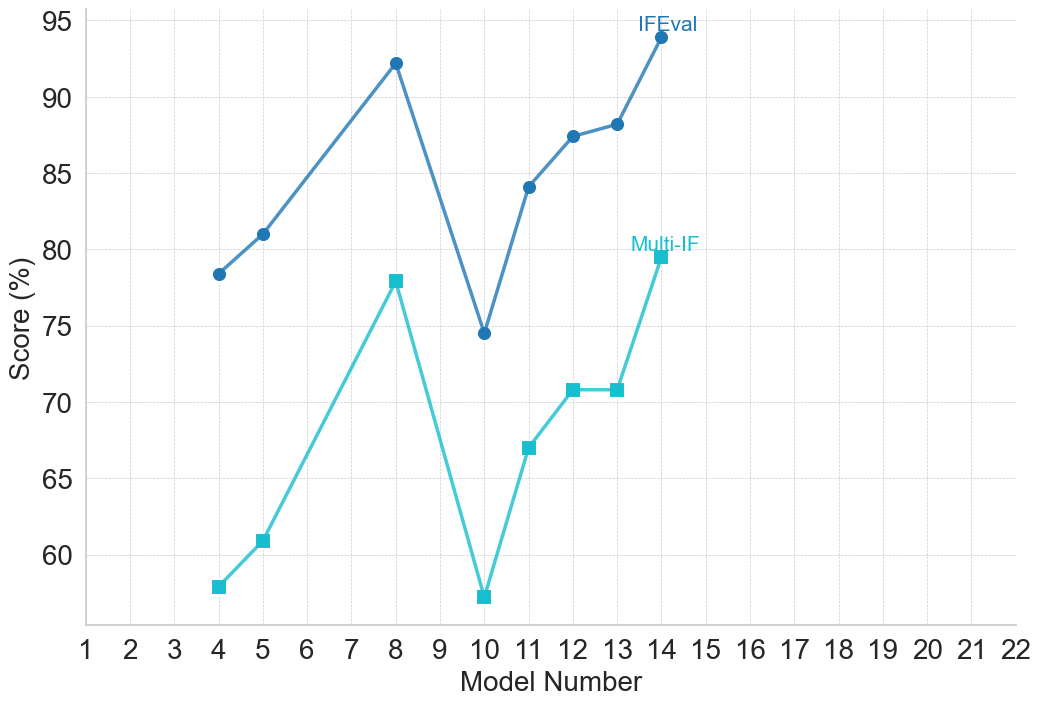
This image is a 2D line chart comparing the performance scores of various models across two distinct evaluation metrics: "IFEval" and "Multi-IF". The chart plots the score percentage on the vertical axis against a sequential model number on the horizontal axis. The data is presented in English; no other languages are present.
### Components/Axes
**Component Isolation & Spatial Grounding:**
* **Y-axis (Left):** Labeled vertically as "Score (%)". The axis features solid black text. Major tick marks are labeled at intervals of 5, starting from 60 and ending at 95 (60, 65, 70, 75, 80, 85, 90, 95). Horizontal grid lines extend from these ticks across the chart area. The grid lines are light gray and dashed.
* **X-axis (Bottom):** Labeled horizontally as "Model Number". The axis features solid black text. Major tick marks are labeled with integers from 1 to 22, inclusive. Vertical grid lines extend upward from each integer. These lines are very faint, solid light gray.
* **Data Series 1 (Top Line):** Represented by a dark blue line with solid circular markers. The label "IFEval" is written in matching dark blue text, positioned in the top-right quadrant of the chart area, directly above the final data point at X=14.
* **Data Series 2 (Bottom Line):** Represented by a cyan (light blue) line with solid square markers. The label "Multi-IF" is written in matching cyan text, positioned in the middle-right area of the chart, directly above the final data point at X=14.
### Detailed Analysis
**Trend Verification:**
Before extracting specific values, the visual trends of both lines must be established.
* **IFEval (Dark Blue, Circles):** The line begins at Model 4, slopes upward to Model 5, and continues a steep upward slope to a peak at Model 8. It then experiences a sharp, steep decline to a local minimum at Model 10. From Model 10, it recovers with a steep upward slope to Model 11, continues a moderate upward slope to Model 12, flattens slightly to Model 13, and finishes with a sharp upward spike to its highest point at Model 14.
* **Multi-IF (Cyan, Squares):** The line follows an almost identical geometric path to the IFEval line, but at a lower absolute Y-value. It starts at Model 4, slopes up to Model 5, spikes to Model 8, drops sharply to a minimum at Model 10, recovers steeply to Model 11, slopes up to Model 12, remains perfectly flat (horizontal) between Model 12 and 13, and finishes with a sharp upward spike to Model 14.
**Data Point Extraction (Reconstructed Data Table):**
*Note: Y-axis values are visual approximations based on the placement of markers relative to the 5-point increment gridlines. Uncertainty is approximately ±0.5%.*
| Model Number (X) | IFEval Score (%) [Dark Blue / Circle] | Multi-IF Score (%) [Cyan / Square] |
| :--- | :--- | :--- |
| 4 | ~ 78.5 | ~ 58.0 |
| 5 | ~ 81.0 | ~ 61.0 |
| 8 | ~ 92.0 | ~ 78.0 |
| 10 | ~ 74.5 | ~ 57.5 |
| 11 | ~ 84.0 | ~ 67.0 |
| 12 | ~ 87.5 | ~ 71.0 |
| 13 | ~ 88.0 | ~ 71.0 |
| 14 | ~ 94.0 | ~ 79.5 |
*Note: Models 1, 2, 3, 6, 7, 9, and 15 through 22 are present on the X-axis but contain no data points.*
### Key Observations
1. **High Correlation:** The most striking visual feature is the parallel movement of the two lines. Every increase or decrease in the IFEval score is mirrored by a corresponding increase or decrease in the Multi-IF score.
2. **Consistent Performance Gap:** The IFEval score is consistently higher than the Multi-IF score for every single model evaluated. The gap between the two metrics ranges roughly between 14% and 20% depending on the specific model.
3. **The "Model 10" Anomaly:** Both metrics show a severe degradation in performance at Model 10. For Multi-IF, Model 10 represents the absolute lowest score on the chart (~57.5%), dropping even below the starting point of Model 4.
4. **Missing Data:** Data is only plotted for 8 specific models out of the 22 listed on the X-axis.
### Interpretation
* **Metric Difficulty:** The data strongly suggests that "Multi-IF" is a significantly more rigorous or difficult evaluation metric than "IFEval". Because the lines move in tandem, we can infer that both metrics are testing related capabilities (likely Instruction Following, given the "IF" acronym), but Multi-IF requires a higher threshold for success or tests more complex scenarios (e.g., multiple constraints simultaneously).
* **Model Progression:** Assuming "Model Number" represents a chronological progression of training checkpoints or sequential versions of a model family, the overall trend is positive. Model 14 is vastly superior to Model 4 across both metrics.
* **Developmental Instability:** The sharp drop at Model 10 indicates a regression in the model's development. In machine learning, this often points to a failed training run, catastrophic forgetting after introducing new data, or a bug in that specific iteration. The subsequent models (11-14) show that the developers successfully corrected this regression.
* **Selective Reporting:** The absence of data for models 1-3, 6-7, and 9 suggests this chart is highlighting specific, notable checkpoints rather than every single iteration. The X-axis extending to 22 while data stops at 14 implies that models 15-22 either exist but haven't been evaluated yet, or the chart was generated with a fixed axis range anticipating future data.