\n
## Line Chart: Model Performance Comparison
### Overview
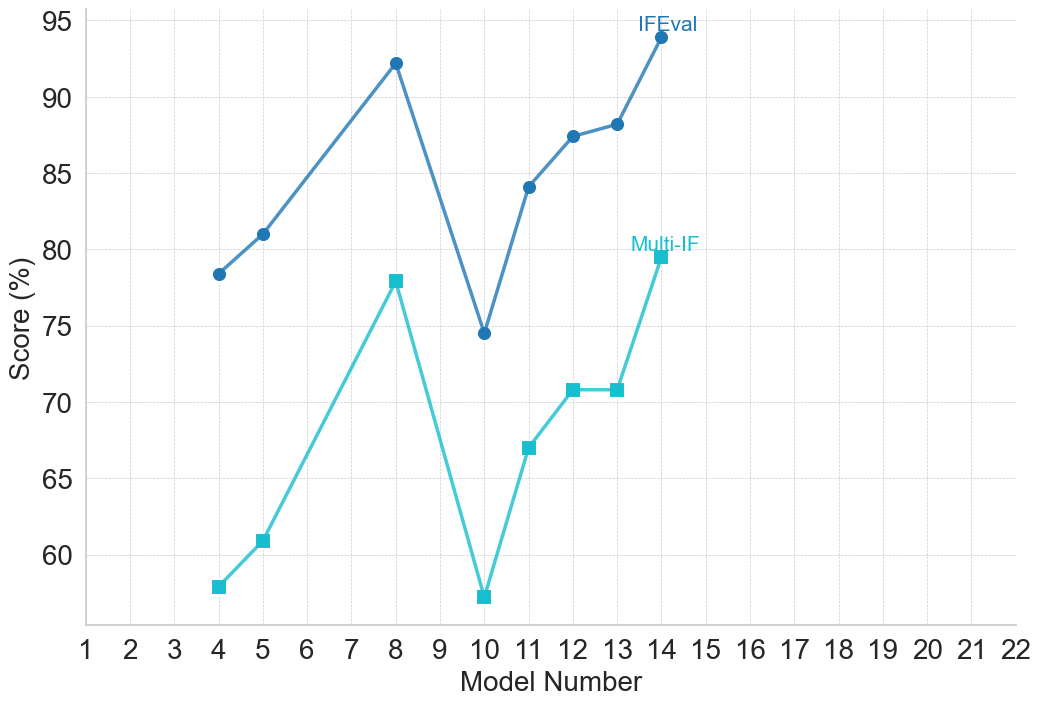
This image presents a line chart comparing the performance scores of two models, "IFEval" and "Multi-IF", across a range of model numbers from 1 to 22. The y-axis represents the score in percentage, while the x-axis represents the model number.
### Components/Axes
* **X-axis:** "Model Number" ranging from 1 to 22.
* **Y-axis:** "Score (%)" ranging from 60 to 95.
* **Data Series 1:** "IFEval" - Represented by a teal line.
* **Data Series 2:** "Multi-IF" - Represented by a light blue line.
* **Legend:** Located in the top-right corner, labeling the two data series with their corresponding colors.
### Detailed Analysis
**IFEval (Teal Line):**
The "IFEval" line generally slopes upward, with significant fluctuations.
* Model 2: Approximately 80%.
* Model 4: Approximately 81%.
* Model 6: Approximately 60%.
* Model 7: Approximately 91%.
* Model 9: Approximately 78%.
* Model 10: Approximately 74%.
* Model 11: Approximately 86%.
* Model 13: Approximately 89%.
* Model 14: Approximately 87%.
* Model 15: Approximately 81%.
**Multi-IF (Light Blue Line):**
The "Multi-IF" line shows a more gradual increase, with a plateau in the middle.
* Model 2: Approximately 62%.
* Model 4: Approximately 60%.
* Model 6: Approximately 61%.
* Model 7: Approximately 77%.
* Model 9: Approximately 79%.
* Model 10: Approximately 60%.
* Model 11: Approximately 66%.
* Model 13: Approximately 72%.
* Model 14: Approximately 80%.
* Model 15: Approximately 81%.
### Key Observations
* "IFEval" consistently scores higher than "Multi-IF" for most model numbers, especially between models 7 and 13.
* "IFEval" exhibits more volatility in its performance, with larger swings in score.
* "Multi-IF" shows a more stable, but generally lower, performance.
* Both models show an overall increasing trend in score as the model number increases, but with fluctuations.
* Model 10 represents a significant dip in performance for both models.
### Interpretation
The chart suggests that the "IFEval" model generally outperforms the "Multi-IF" model across the tested range of model numbers. However, "IFEval" is also more sensitive to changes in the model number, as evidenced by its larger score fluctuations. The dip in performance at Model 10 for both models could indicate a specific issue or limitation within that model configuration. The overall upward trend suggests that both models benefit from increasing model number, potentially due to increased complexity or training data. The difference in volatility between the two models could be indicative of different underlying algorithms or training methodologies. "IFEval" might be more powerful but less robust, while "Multi-IF" is more stable but less capable of achieving peak performance. Further investigation into the specific characteristics of Model 10 and the factors driving the performance differences between the two models would be beneficial.