## Scatter Plot: Byte 0 Timing Analysis
### Overview
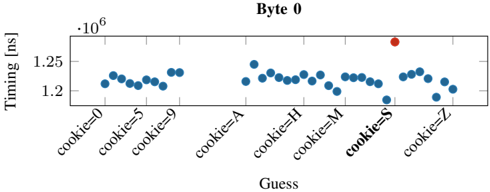
The image is a scatter plot titled **"Byte 0"**, visualizing the relationship between guessed values ("Guess") and timing measurements ("Timing [ns]"). The x-axis represents categorical guesses (e.g., "cookie=0", "cookie=5", ..., "cookie=Z"), while the y-axis quantifies timing in nanoseconds (ns). A single red outlier is prominently visible, contrasting with numerous blue data points clustered around a narrow timing range.
---
### Components/Axes
- **Title**: "Byte 0" (centered at the top).
- **Y-Axis**: Labeled **"Timing [ns]"** with a logarithmic scale (10⁻⁶), ranging from ~1.2 to 1.25 ns.
- **X-Axis**: Labeled **"Guess"**, with discrete categories:
- `cookie=0`, `cookie=5`, `cookie=9`, `cookie=A`, `cookie=H`, `cookie=M`, `cookie=S`, `cookie=Z`.
- **Data Points**:
- **Blue**: ~20 points clustered tightly between 1.2e-6 and 1.25e-6 ns.
- **Red**: A single outlier at `cookie=S` with a timing of **1.25e-6 ns**.
---
### Detailed Analysis
- **Timing Distribution**:
- Most data points (blue) fall within **1.2e-6 ± 0.05e-6 ns**, indicating high consistency.
- The red outlier at `cookie=S` deviates by **~0.05e-6 ns** (4.17% increase), suggesting an anomaly.
- **X-Axis Categories**:
- Categories are ordered numerically (`0`, `5`, `9`) followed by alphabetical (`A`, `H`, `M`, `S`, `Z`).
- Spacing between categories appears uniform, though exact pixel positions are unspecified.
- **Color Coding**:
- Blue dominates, representing the majority of guesses.
- Red is used exclusively for the outlier at `cookie=S`.
---
### Key Observations
1. **Outlier at `cookie=S`**:
- The red point at `cookie=S` is the only value exceeding 1.25e-6 ns, standing out from the blue cluster.
2. **Consistency in Other Guesses**:
- All other guesses (e.g., `cookie=0`, `cookie=5`, `cookie=Z`) exhibit nearly identical timing, implying predictable behavior.
3. **Scale Sensitivity**:
- The y-axis uses a logarithmic scale (10⁻⁶), emphasizing minute timing differences critical for performance analysis.
---
### Interpretation
- **Technical Implications**:
- The outlier at `cookie=S` suggests a potential edge case or error condition when the guessed value is `'S'`. This could indicate a special handling path, a bug, or a misconfiguration in the system.
- The uniformity of other guesses implies that the system’s response time is stable for most inputs, with timing variations likely due to measurement noise or minor environmental factors.
- **Investigative Insights**:
- The red outlier warrants further scrutiny: Is `'S'` a valid guess, or was it misclassified? Could this represent a timing attack vector in a cryptographic context?
- The tight clustering of blue points suggests the system’s performance is optimized for the majority of cases, but the outlier highlights a vulnerability or inefficiency.
---
### Final Notes
- **Language**: All text is in English.
- **Data Integrity**: No explicit legend is present, but color coding (blue/red) is consistent with the described trends.
- **Uncertainty**: Approximate values are inferred from visual inspection; exact numerical precision cannot be guaranteed without raw data.