\n
## Scatter Plot: Timing vs. Guess (Byte 0)
### Overview
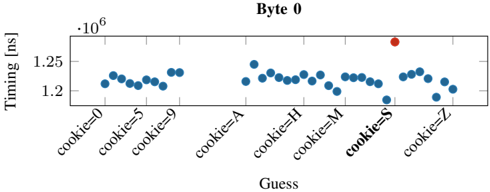
This image presents a scatter plot illustrating the relationship between "Guess" values (representing potential cookie values) and "Timing" measurements in nanoseconds (ns). The plot focuses on Byte 0 of a cookie. The majority of data points cluster around a relatively consistent timing value, with a single outlier significantly deviating from this pattern.
### Components/Axes
* **X-axis:** "Guess" - Categorical variable representing potential cookie values. The categories are: "cookie=0", "cookie=5", "cookie=9", "cookie=A", "cookie=H", "cookie=M", "cookie=S", "cookie=Z".
* **Y-axis:** "Timing [ns]" - Numerical variable representing the time taken, measured in nanoseconds. The scale ranges from approximately 1.18 x 10<sup>6</sup> ns to 1.26 x 10<sup>6</sup> ns.
* **Data Points:** Blue circles represent the timing measurements for each guess.
* **Outlier:** A single red circle represents a significantly higher timing measurement.
* **Title:** "Byte 0" - Indicates the plot represents data for the first byte of a cookie.
### Detailed Analysis
The majority of the data points (blue circles) exhibit a relatively stable timing value, fluctuating between approximately 1.20 x 10<sup>6</sup> ns and 1.24 x 10<sup>6</sup> ns. There is a slight undulating pattern, with minor peaks and troughs across the different "Guess" values.
Here's a breakdown of approximate timing values for each guess:
* **cookie=0:** ~1.22 x 10<sup>6</sup> ns
* **cookie=5:** ~1.23 x 10<sup>6</sup> ns
* **cookie=9:** ~1.21 x 10<sup>6</sup> ns
* **cookie=A:** ~1.24 x 10<sup>6</sup> ns
* **cookie=H:** ~1.24 x 10<sup>6</sup> ns
* **cookie=M:** ~1.22 x 10<sup>6</sup> ns
* **cookie=S:** ~1.19 x 10<sup>6</sup> ns
* **cookie=Z:** ~1.21 x 10<sup>6</sup> ns
The outlier (red circle) is located at "cookie=S" and has a timing value of approximately 1.255 x 10<sup>6</sup> ns. This is significantly higher than all other data points.
### Key Observations
* The timing values are relatively consistent across most "Guess" values.
* The outlier at "cookie=S" represents a substantial deviation from the typical timing behavior.
* There is no clear monotonic trend (increasing or decreasing) in the timing values as the "Guess" values change.
### Interpretation
This data likely represents a timing attack scenario, where the attacker attempts to guess the value of a cookie byte by measuring the time it takes for a server to respond. The consistent timing values for most guesses suggest that the server is not significantly affected by the input value. However, the outlier at "cookie=S" indicates that this particular guess triggers a different code path or operation that takes considerably longer to execute. This could be due to a conditional statement, a cache miss, or other performance-sensitive factors.
The attacker could use this information to narrow down the possible values of the cookie byte. The outlier provides a strong indication that "cookie=S" is a likely candidate. This type of analysis is crucial in identifying and mitigating timing vulnerabilities in security-sensitive applications. The fact that only Byte 0 is shown suggests this is part of a larger analysis of all cookie bytes.