## Scatter Plot: Byte 0 Timing Analysis
### Overview
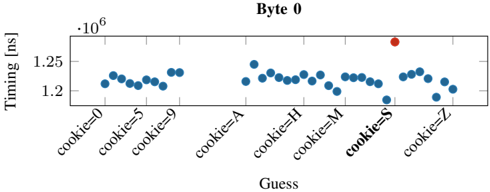
The image is a scatter plot chart titled "Byte 0". It displays timing measurements (in nanoseconds) for a series of guesses, likely related to a cryptographic or computational process where a correct guess is distinguishable by its timing signature. The chart contains one clear outlier data point.
### Components/Axes
* **Title:** "Byte 0" (centered at the top).
* **Y-Axis:**
* **Label:** "Timing [ns]" (indicating time in nanoseconds).
* **Scale:** Linear scale with a multiplier of `·10^6` (meaning values are in millions of nanoseconds).
* **Major Ticks:** 1.2 and 1.25 (representing 1,200,000 ns and 1,250,000 ns).
* **X-Axis:**
* **Label:** "Guess".
* **Categories:** A series of discrete labels representing different guess values. From left to right: `cookie=0`, `cookie=5`, `cookie=9`, `cookie=A`, `cookie=H`, `cookie=M`, `cookie=S`, `cookie=Z`.
* **Legend:** Located in the top-right corner of the plot area.
* A blue circle symbol is labeled "Guess".
* A red circle symbol is labeled "Correct".
### Detailed Analysis
* **Data Series - "Guess" (Blue Points):**
* **Trend:** The blue data points form a relatively flat, horizontal band with minor vertical scatter. There is no strong upward or downward slope across the categories.
* **Values:** The timing for all "Guess" points clusters tightly between approximately 1.18 x 10^6 ns and 1.25 x 10^6 ns. Most points appear to be centered around 1.22 x 10^6 ns.
* **Spatial Distribution:** The points are evenly spaced along the x-axis, corresponding to each labeled guess category. There is no data point for the category `cookie=S` in the blue series.
* **Data Series - "Correct" (Red Point):**
* **Trend:** This is a single, isolated data point.
* **Value:** The red point is positioned significantly higher than the blue cluster, at approximately 1.28 x 10^6 ns.
* **Spatial Grounding:** This point is located directly above the x-axis label `cookie=S`.
### Key Observations
1. **Clear Outlier:** The single red "Correct" point is a distinct outlier, showing a timing value roughly 50,000 ns (or ~4%) higher than the average of the "Guess" points.
2. **Consistent Baseline:** The timing for incorrect guesses ("Guess") is remarkably consistent across different values (0, 5, 9, A, H, M, Z), suggesting a uniform processing path for wrong inputs.
3. **Missing Blue Point:** There is no blue "Guess" data point plotted for the `cookie=S` category. The only point at that x-position is the red "Correct" point.
4. **Axis Scaling:** The y-axis uses a multiplier (·10^6), which is critical for interpreting the absolute timing values correctly.
### Interpretation
This chart is characteristic of a **timing side-channel analysis**, likely from a cryptographic implementation or a security-focused performance test.
* **What the data suggests:** The experiment measures the time taken to process a guess for the first byte ("Byte 0") of a secret value (e.g., a cookie, key, or password). The system exhibits a measurable timing difference when the guess is correct.
* **How elements relate:** The x-axis represents the attacker's guesses. The y-axis represents the observed processing time. The legend distinguishes between the attacker's guesses (blue) and the one correct value (red). The spatial alignment of the red point with `cookie=S` identifies "S" as the correct byte value.
* **Notable Anomaly & Implication:** The primary anomaly is the elevated timing for the correct guess. This is a classic **timing leak**. In a secure system, all operations should take constant time regardless of the input value. The observed difference (~50,000 ns) is large and consistent enough to be reliably exploited by an attacker to iteratively discover secret data one byte at a time by monitoring response times. The chart visually proves the existence of this vulnerability for "Byte 0".