## Heatmap: Byte 0
### Overview
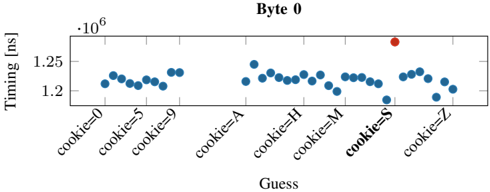
The heatmap displays the timing measurements in nanoseconds (ns) for different cookies (cookie=0 to cookie=Z) at Byte 0. The x-axis represents the cookies, and the y-axis represents the timing in nanoseconds.
### Components/Axes
- **X-axis**: Labeled "cookie=0" to "cookie=Z" with values 0, 5, 9, A, H, M, S, and Z.
- **Y-axis**: Labeled "Timing (ns)" with a scale from 1.2 to 1.35.
- **Legend**: Located at the bottom right, indicating the color coding for the cookies.
- **Title**: "Byte 0" at the top center.
### Detailed Analysis or ### Content Details
The heatmap shows a distribution of timing measurements across different cookies. The majority of the data points are clustered around the 1.2 ns mark, with some points slightly above and below this value. The red dot stands out, indicating a significantly higher timing measurement compared to the other data points.
### Key Observations
- The majority of the data points are close to 1.2 ns.
- There is a notable outlier at the red dot, which is significantly higher than the rest.
- The distribution appears to be relatively even, with no single cookie having a drastically higher or lower timing measurement.
### Interpretation
The heatmap suggests that the timing measurements for most cookies at Byte 0 are relatively consistent, with most falling within a narrow range of 1.2 ns. The outlier at the red dot indicates a potential issue or anomaly in the timing measurement for that specific cookie. This could be due to a variety of factors, such as a hardware malfunction, a software bug, or an unusual data point. Further investigation would be needed to determine the cause of this outlier and to understand its implications for the overall system performance.