# Technical Data Extraction: Model Accuracy vs. Generation Budget
## 1. Image Overview
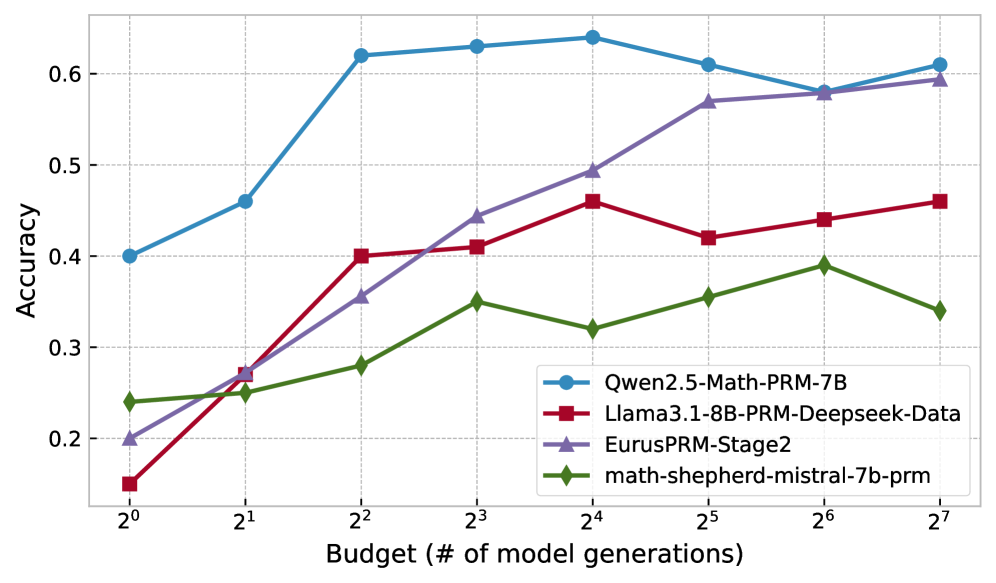
This image is a line graph plotting the **Accuracy** of four different Process Reward Models (PRMs) against a varying **Budget (# of model generations)**. The chart uses a logarithmic scale for the x-axis and a linear scale for the y-axis.
## 2. Axis and Legend Specifications
### Axis Labels
* **Y-Axis:** "Accuracy" (Linear scale ranging from approximately 0.15 to 0.65).
* **X-Axis:** "Budget (# of model generations)" (Logarithmic scale base 2, ranging from $2^0$ to $2^7$).
### Axis Markers
* **Y-Axis Markers:** 0.2, 0.3, 0.4, 0.5, 0.6.
* **X-Axis Markers:** $2^0$ (1), $2^1$ (2), $2^2$ (4), $2^3$ (8), $2^4$ (16), $2^5$ (32), $2^6$ (64), $2^7$ (128).
### Legend
| Color | Marker Shape | Label |
| :--- | :--- | :--- |
| **Blue** | Circle (●) | Qwen2.5-Math-PRM-7B |
| **Red** | Square (■) | Llama3.1-8B-PRM-Deepseek-Data |
| **Purple** | Triangle (▲) | EurusPRM-Stage2 |
| **Green** | Diamond (◆) | math-shepherd-mistral-7b-prm |
---
## 3. Data Series Analysis and Trends
### Series 1: Qwen2.5-Math-PRM-7B (Blue, Circle)
* **Trend:** This model consistently maintains the highest accuracy across almost all budget levels. It shows a sharp upward slope from $2^0$ to $2^2$, plateaus/peaks between $2^3$ and $2^4$, experiences a slight dip at $2^6$, and recovers at $2^7$.
* **Estimated Data Points:**
* $2^0$: 0.40
* $2^1$: 0.46
* $2^2$: 0.62
* $2^3$: 0.63
* $2^4$: 0.64 (Peak)
* $2^5$: 0.61
* $2^6$: 0.58
* $2^7$: 0.61
### Series 2: EurusPRM-Stage2 (Purple, Triangle)
* **Trend:** Shows the most consistent and steepest positive linear growth relative to the log-scale budget. It starts as the second-lowest performer and ends as the second-highest, nearly converging with the Qwen model at the highest budget.
* **Estimated Data Points:**
* $2^0$: 0.20
* $2^1$: 0.27
* $2^2$: 0.35
* $2^3$: 0.44
* $2^4$: 0.49
* $2^5$: 0.57
* $2^6$: 0.58
* $2^7$: 0.59
### Series 3: Llama3.1-8B-PRM-Deepseek-Data (Red, Square)
* **Trend:** Starts with the lowest accuracy at $2^0$. It shows a significant jump at $2^2$, followed by a generally upward but volatile trend, including a notable dip at $2^5$.
* **Estimated Data Points:**
* $2^0$: 0.15
* $2^1$: 0.27
* $2^2$: 0.40
* $2^3$: 0.41
* $2^4$: 0.46
* $2^5$: 0.42
* $2^6$: 0.44
* $2^7$: 0.46
### Series 4: math-shepherd-mistral-7b-prm (Green, Diamond)
* **Trend:** This is the lowest-performing model overall for budgets $> 2^1$. The trend is generally upward but very shallow compared to the others, with a peak at $2^6$ followed by a decline at $2^7$.
* **Estimated Data Points:**
* $2^0$: 0.24
* $2^1$: 0.25
* $2^2$: 0.28
* $2^3$: 0.35
* $2^4$: 0.32
* $2^5$: 0.35
* $2^6$: 0.39
* $2^7$: 0.34
---
## 4. Summary Table of Extracted Values (Approximate)
| Budget ($2^x$) | Qwen2.5 (Blue) | EurusPRM (Purple) | Llama3.1 (Red) | Math-Shepherd (Green) |
| :--- | :--- | :--- | :--- | :--- |
| **1 ($2^0$)** | 0.40 | 0.20 | 0.15 | 0.24 |
| **2 ($2^1$)** | 0.46 | 0.27 | 0.27 | 0.25 |
| **4 ($2^2$)** | 0.62 | 0.35 | 0.40 | 0.28 |
| **8 ($2^3$)** | 0.63 | 0.44 | 0.41 | 0.35 |
| **16 ($2^4$)** | 0.64 | 0.49 | 0.46 | 0.32 |
| **32 ($2^5$)** | 0.61 | 0.57 | 0.42 | 0.35 |
| **64 ($2^6$)** | 0.58 | 0.58 | 0.44 | 0.39 |
| **128 ($2^7$)** | 0.61 | 0.59 | 0.46 | 0.34 |