# Technical Document Extraction: Line Chart Analysis
## Chart Overview
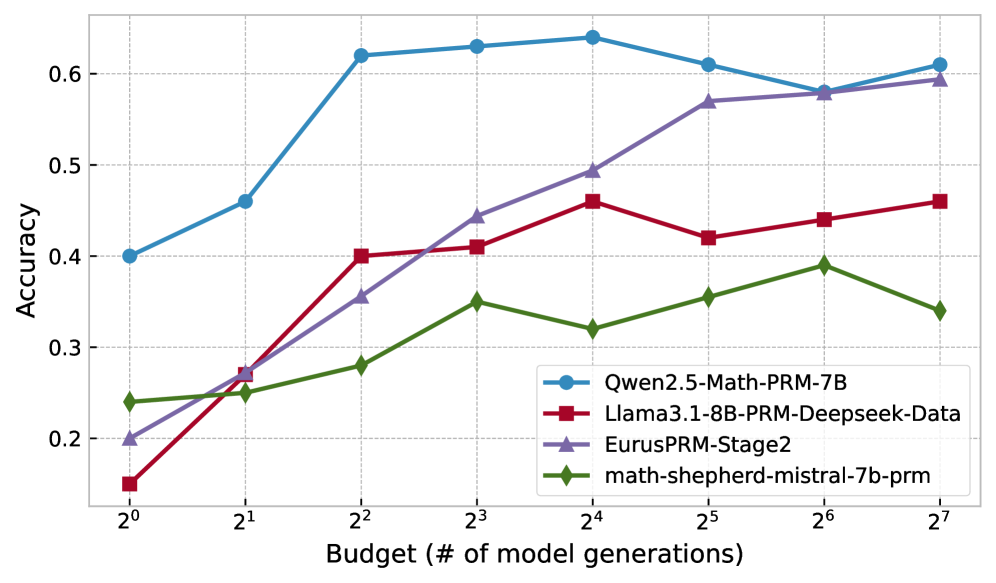
The image depicts a line chart comparing the accuracy of four different language models across varying computational budgets. The chart uses distinct colors and markers for each model, with a logarithmic scale on the x-axis representing model generations.
## Axes and Labels
- **X-axis**: "Budget (# of model generations)"
- Values: 2⁰, 2¹, 2², 2³, 2⁴, 2⁵, 2⁶, 2⁷
- Scale: Logarithmic (powers of 2)
- **Y-axis**: "Accuracy"
- Range: 0.2 to 0.6
- Increment: 0.1
## Legend
Located in the bottom-right corner, the legend maps colors/markers to models:
1. **Blue circles**: Qwen2.5-Math-PRM-7B
2. **Red squares**: Llama3.1-8B-PRM-Deepseek-Data
3. **Purple triangles**: EurusPRM-Stage2
4. **Green diamonds**: math-shepherd-mistral-7b-prm
## Data Series Analysis
### 1. Qwen2.5-Math-PRM-7B (Blue Circles)
- **Trend**: Initial rapid increase, peaking at 2⁴, followed by a slight decline.
- **Key Points**:
- 2⁰: 0.40
- 2¹: 0.46
- 2²: 0.62
- 2³: 0.63
- 2⁴: 0.64
- 2⁵: 0.61
- 2⁶: 0.58
- 2⁷: 0.61
### 2. Llama3.1-8B-PRM-Deepseek-Data (Red Squares)
- **Trend**: Steady growth until 2⁴, then gradual decline with minor fluctuations.
- **Key Points**:
- 2⁰: 0.15
- 2¹: 0.27
- 2²: 0.40
- 2³: 0.41
- 2⁴: 0.46
- 2⁵: 0.42
- 2⁶: 0.44
- 2⁷: 0.46
### 3. EurusPRM-Stage2 (Purple Triangles)
- **Trend**: Consistent upward trajectory throughout all generations.
- **Key Points**:
- 2⁰: 0.20
- 2¹: 0.27
- 2²: 0.35
- 2³: 0.43
- 2⁴: 0.49
- 2⁵: 0.57
- 2⁶: 0.58
- 2⁷: 0.60
### 4. math-shepherd-mistral-7b-prm (Green Diamonds)
- **Trend**: Initial growth, peak at 2⁶, followed by a sharp decline.
- **Key Points**:
- 2⁰: 0.24
- 2¹: 0.25
- 2²: 0.28
- 2³: 0.35
- 2⁴: 0.32
- 2⁵: 0.35
- 2⁶: 0.39
- 2⁷: 0.34
## Spatial Grounding
- **Legend Position**: Bottom-right corner (confirmed via visual alignment).
- **Color Consistency**:
- Blue circles match Qwen2.5-Math-PRM-7B line.
- Red squares align with Llama3.1-8B-PRM-Deepseek-Data.
- Purple triangles correspond to EurusPRM-Stage2.
- Green diamonds match math-shepherd-mistral-7b-prm.
## Component Isolation
1. **Header**: No explicit header text.
2. **Main Chart**:
- Gridlines: Dashed lines at 0.1 intervals.
- Data Points: Markers (circles, squares, triangles, diamonds) with connecting lines.
3. **Footer**: No footer text.
## Critical Observations
- **Highest Accuracy**: Qwen2.5-Math-PRM-7B achieves the highest accuracy (0.64 at 2⁴).
- **Most Efficient Growth**: EurusPRM-Stage2 shows the steepest improvement per generation.
- **Diminishing Returns**: Qwen2.5-Math-PRM-7B and math-shepherd-mistral-7b-prm exhibit reduced gains after 2⁴.
## Language Notes
- **Primary Language**: English (all labels, axis titles, and legends).
- **No Additional Languages**: No non-English text detected.
## Conclusion
The chart demonstrates that computational budget significantly impacts model accuracy, with Qwen2.5-Math-PRM-7B and EurusPRM-Stage2 outperforming others in later generations. The logarithmic x-axis emphasizes scalability trends across model generations.