## Heatmap: Action Probability in the Policy
### Overview
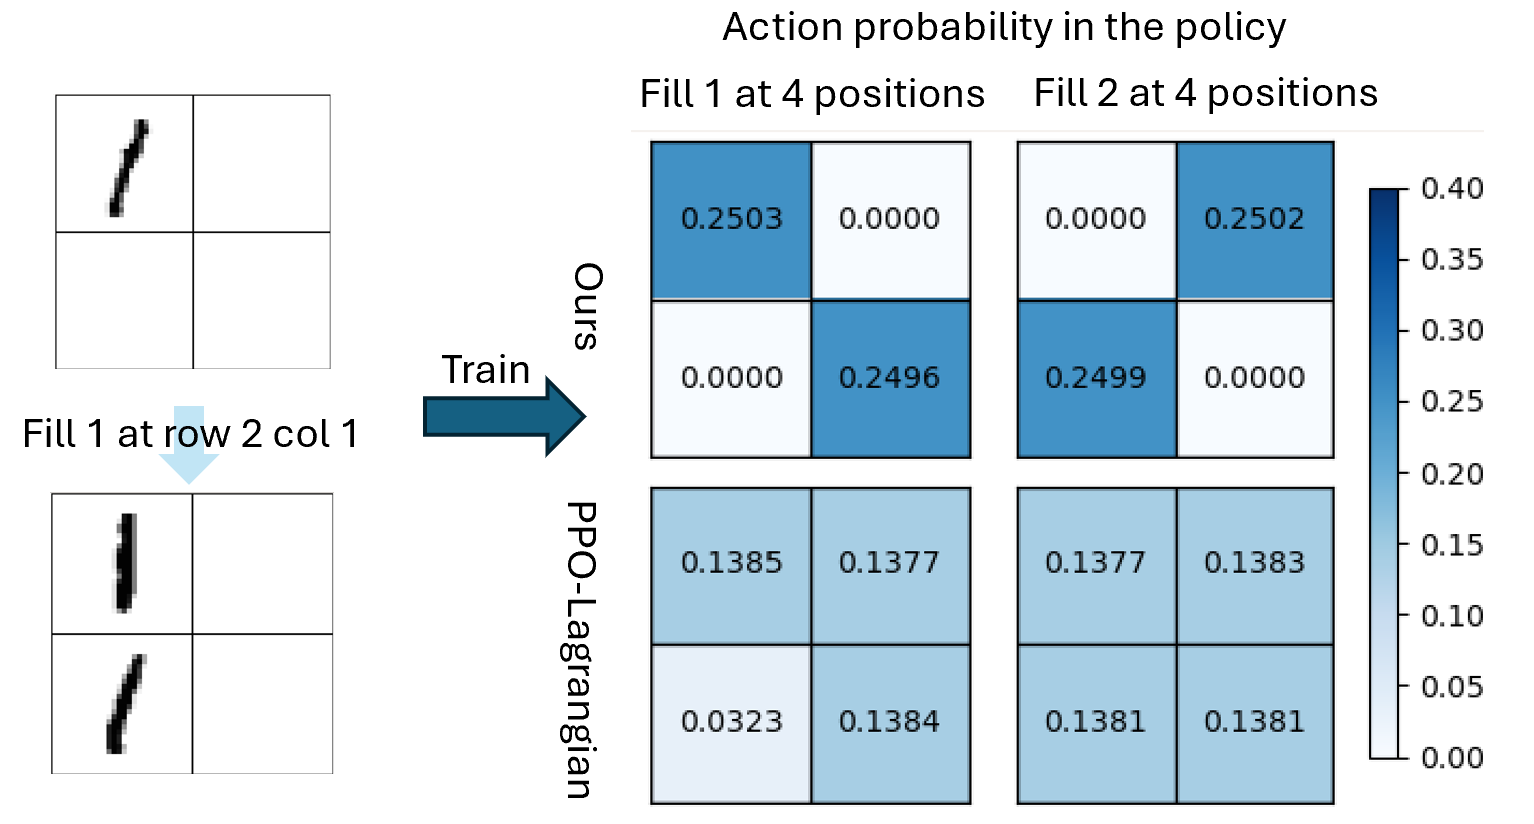
The image presents a comparison of action probabilities in a policy, comparing two methods ("Ours" and "PPO-Lagrangian") for two different actions ("Fill 1" and "Fill 2") across four positions. The action probabilities are visualized as heatmaps, with color intensity representing the probability value. The image also shows an example of the training data.
### Components/Axes
* **Title:** Action probability in the policy
* **X-Axis (Top):** "Fill 1 at 4 positions", "Fill 2 at 4 positions"
* **Y-Axis (Left):** "Ours", "PPO-Lagrangian"
* **Colorbar (Right):** Represents probability values, ranging from 0.00 to 0.40. The color gradient goes from white (0.00) to dark blue (0.40).
* 0.00
* 0.05
* 0.10
* 0.15
* 0.20
* 0.25
* 0.30
* 0.35
* 0.40
* **Training Data (Left):** Two 2x2 grids representing the training data. The top grid shows a partial stroke, and the bottom grid shows the result of "Fill 1 at row 2 col 1". An arrow labeled "Train" points from the training data to the heatmaps.
### Detailed Analysis
The heatmap is structured as a 2x2 grid, where each cell represents the probability of taking a specific action at a specific position.
**"Ours" Method:**
* **Fill 1 at 4 positions:**
* Top-left: 0.2503 (Dark Blue)
* Top-right: 0.0000 (White)
* Bottom-left: 0.0000 (White)
* Bottom-right: 0.2496 (Dark Blue)
* **Fill 2 at 4 positions:**
* Top-left: 0.0000 (White)
* Top-right: 0.2502 (Dark Blue)
* Bottom-left: 0.2499 (Dark Blue)
* Bottom-right: 0.0000 (White)
**"PPO-Lagrangian" Method:**
* **Fill 1 at 4 positions:**
* Top-left: 0.1385 (Light Blue)
* Top-right: 0.1377 (Light Blue)
* Bottom-left: 0.0323 (Almost White)
* Bottom-right: 0.1384 (Light Blue)
* **Fill 2 at 4 positions:**
* Top-left: 0.1377 (Light Blue)
* Top-right: 0.1383 (Light Blue)
* Bottom-left: 0.1381 (Light Blue)
* Bottom-right: 0.1381 (Light Blue)
### Key Observations
* The "Ours" method shows a strong preference for specific positions when filling, with probabilities close to 0.25 for two positions and 0.00 for the other two.
* The "PPO-Lagrangian" method shows a more uniform distribution of probabilities across all positions, with values around 0.13-0.14.
* The color intensity directly corresponds to the probability value, as indicated by the colorbar.
### Interpretation
The data suggests that the "Ours" method has learned a more deterministic policy, focusing on specific positions for each action. In contrast, the "PPO-Lagrangian" method has learned a more stochastic policy, distributing probabilities more evenly across all positions. This could indicate that the "Ours" method is more confident in its actions, while the "PPO-Lagrangian" method is more exploratory. The training data provides context for the actions, showing the initial state and the result of filling a specific position.