## Heatmap: Action probability in the policy
### Overview
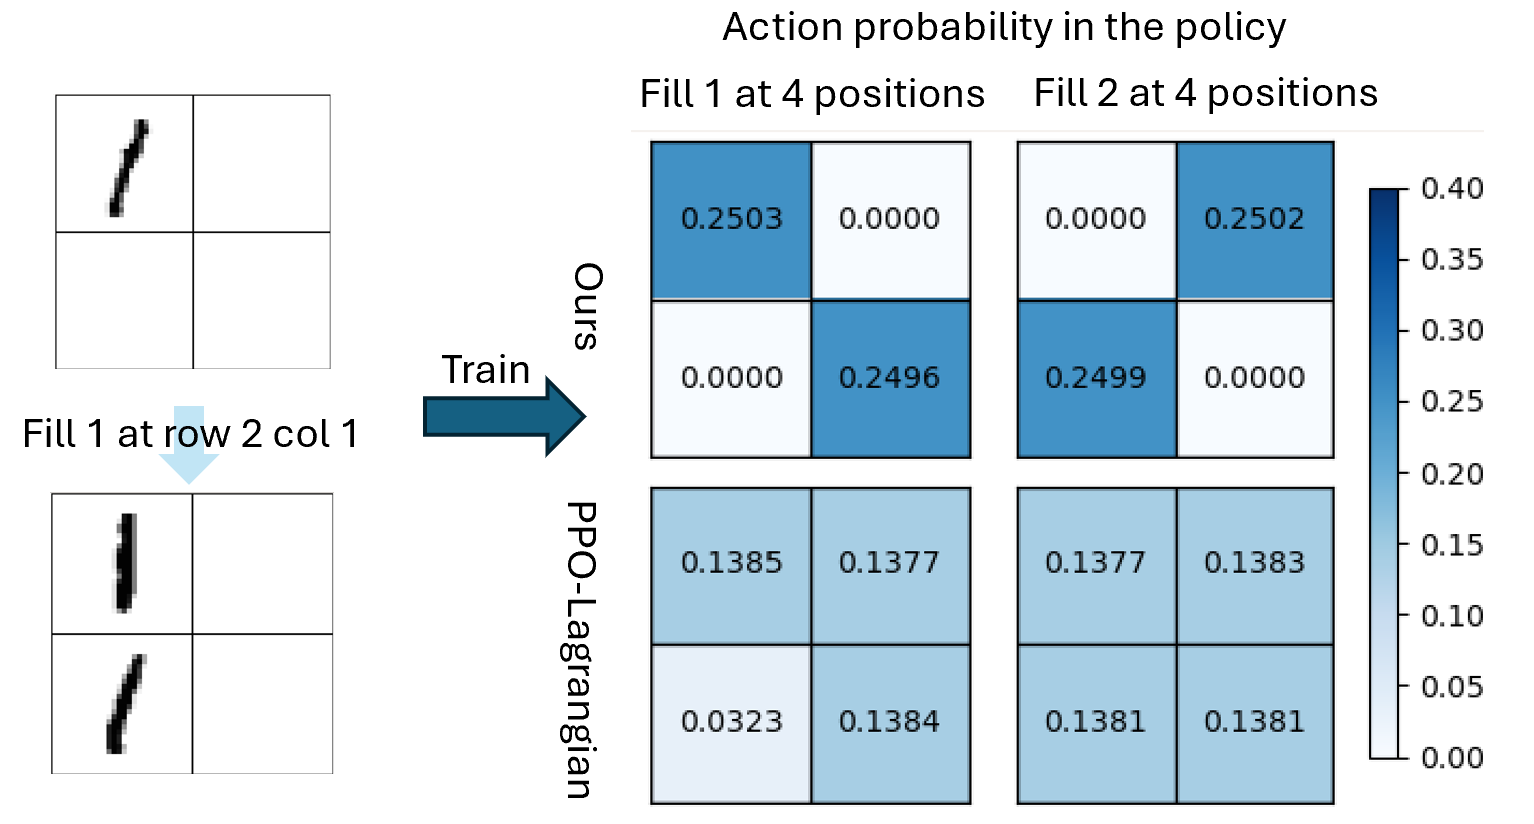
The image compares action probabilities in a policy across two methods ("Ours" and "PPO-Lagrangian") for two scenarios: "Fill 1 at 4 positions" and "Fill 2 at 4 positions". The left side shows two diagrams illustrating grid-based actions, while the right side contains heatmaps with numerical values and a color scale.
### Components/Axes
- **Main Title**: "Action probability in the policy"
- **Left Diagrams**:
- Top: Grid with diagonal line in top-left quadrant (labeled "Fill 1 at row 2 col 1")
- Bottom: Grid with two diagonal lines in first column (same label)
- Arrow connects diagrams to right-side tables
- **Right Tables**:
- **Rows**: "Ours" (top), "PPO-Lagrangian" (bottom)
- **Columns**:
- "Fill 1 at 4 positions" (left)
- "Fill 2 at 4 positions" (right)
- **Color Scale**:
- Vertical bar on right (0.00 to 0.40)
- Darker blue = higher probability
### Detailed Analysis
#### "Ours" Method
- **Fill 1 at 4 positions**:
- Top-left: 0.2503 (dark blue)
- Bottom-right: 0.2496 (medium blue)
- **Fill 2 at 4 positions**:
- Top-right: 0.2502 (dark blue)
- Bottom-left: 0.2499 (medium blue)
#### "PPO-Lagrangian" Method
- **Fill 1 at 4 positions**:
- Top-left: 0.1385 (light blue)
- Bottom-right: 0.1384 (light blue)
- **Fill 2 at 4 positions**:
- Top-right: 0.1381 (light blue)
- Bottom-left: 0.1383 (light blue)
### Key Observations
1. **Probability Disparity**: "Ours" consistently shows 2x higher probabilities than PPO-Lagrangian across all positions.
2. **Positional Variation**:
- "Ours" shows slight differences between positions (e.g., 0.2503 vs 0.2496 in Fill 1)
- PPO-Lagrangian values are nearly identical across positions (0.1381-0.1385)
3. **Color Consistency**: Darker blue in "Ours" matches higher values (0.25) vs lighter blue in PPO-Lagrangian (0.138)
### Interpretation
The data demonstrates that the "Ours" policy assigns significantly higher action probabilities to specific grid positions compared to PPO-Lagrangian. The heatmaps reveal:
- **Selective Focus**: "Ours" prioritizes certain positions (e.g., top-left in Fill 1) with near-maximum probabilities
- **Uniform Distribution**: PPO-Lagrangian maintains nearly identical probabilities across all positions, suggesting a more generalized approach
- **Policy Effectiveness**: The 2x probability difference implies "Ours" may be more efficient at targeting specific actions in this grid-based task
The diagrams on the left visually represent the action selection process, with the arrow indicating the transformation from initial state (single diagonal line) to policy output (dual lines in "Ours" method). This spatial grounding connects the abstract probability values to concrete grid-based actions.