\n
## Chart: Importance Score vs. Reasoning Step
### Overview
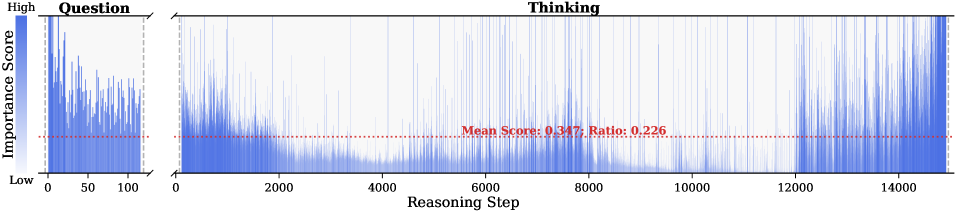
The image presents a chart visualizing the "Importance Score" over "Reasoning Step". The chart appears to represent the relative importance of each reasoning step during a problem-solving process, divided into "Question" and "Thinking" phases. The chart consists of a dense series of vertical lines, representing the importance score at each step. A horizontal dashed line indicates the mean importance score.
### Components/Axes
* **X-axis:** "Reasoning Step", ranging from 0 to approximately 15000.
* **Y-axis:** "Importance Score", ranging from "Low" to "High". The scale is not explicitly numerical, but visually represents a gradient.
* **Chart Title/Sections:** The chart is divided into two sections labeled "Question" (from 0 to approximately 100 Reasoning Steps) and "Thinking" (from approximately 100 to 15000 Reasoning Steps).
* **Mean Score Indicator:** A horizontal dashed red line is present, labeled "Mean Score: 0.347, Ratio: 0.226".
* **Color Gradient:** A blue color gradient is used to represent the "Importance Score", with darker blues indicating higher scores and lighter blues indicating lower scores.
### Detailed Analysis
The chart displays a fluctuating importance score across reasoning steps.
* **Question Phase (0-100 Reasoning Steps):** The importance score fluctuates rapidly and significantly. The score starts at a low value, quickly rises to high values, and then decreases again. The vertical lines are densely packed, indicating a high frequency of importance score changes.
* **Thinking Phase (100-15000 Reasoning Steps):** The importance score continues to fluctuate, but generally remains lower and more stable than in the "Question" phase. The fluctuations are less dramatic, and the score tends to hover around the mean score. There are periods of increased activity (higher importance scores) interspersed with periods of lower activity.
* **Mean Score:** The mean importance score is 0.347, with a ratio of 0.226. The ratio is not defined in the image.
* **Visual Trend:** The "Question" phase shows a rapid and volatile change in importance score. The "Thinking" phase shows a more gradual and sustained fluctuation around the mean.
### Key Observations
* The "Question" phase exhibits significantly higher variability in importance score compared to the "Thinking" phase.
* The mean importance score appears to be a reasonable representation of the typical importance score during the "Thinking" phase.
* There are no obvious outliers or anomalies in the data, but the high frequency of fluctuations suggests a complex and dynamic reasoning process.
### Interpretation
The chart suggests that the initial "Question" phase of problem-solving involves a rapid exploration of different ideas and considerations, leading to significant fluctuations in the perceived importance of each reasoning step. The "Thinking" phase, on the other hand, represents a more focused and deliberate process, with a more stable and consistent importance score. The mean score provides a baseline for evaluating the relative importance of individual reasoning steps. The ratio of 0.226 is not defined, but could represent the proportion of reasoning steps above the mean score.
The data suggests that the initial phase of problem-solving is characterized by uncertainty and exploration, while the subsequent phase is characterized by refinement and consolidation. The fluctuations in importance score likely reflect the iterative nature of the reasoning process, as new information is considered and existing assumptions are challenged.