## Line Chart: Importance Score Across Reasoning Steps
### Overview
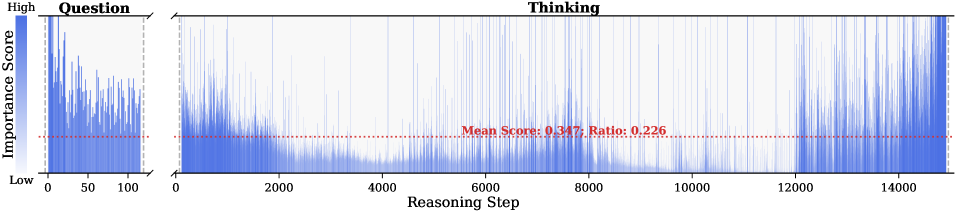
The image displays a line chart divided into two sections: "Question" (left) and "Thinking" (right). The chart visualizes the distribution of "Importance Score" across sequential "Reasoning Steps," with a red dashed line indicating a calculated mean score and ratio. The y-axis uses a gradient from blue (low) to white (high) to represent importance scores.
---
### Components/Axes
- **X-Axis (Reasoning Step)**:
- Labeled "Reasoning Step" with numerical markers at 0, 500, 1000, 1500, ..., 14,000.
- Divided into two regions by vertical dashed lines at **100** (end of "Question") and **14,000** (end of "Thinking").
- **Y-Axis (Importance Score)**:
- Labeled "Importance Score" with a gradient scale from **Low** (blue) to **High** (white).
- No explicit numerical scale, but the red dashed line is positioned at **0.347**.
- **Legend**:
- Located on the left, with a single entry: **Blue** (representing all data points).
- **Annotations**:
- Red dashed line labeled **"Mean Score: 0.347; Ratio: 0.226"** centered horizontally.
---
### Detailed Analysis
1. **"Question" Section (0–100 Reasoning Steps)**:
- High density of vertical blue lines, indicating frequent reasoning steps.
- Importance scores cluster near the top of the y-axis (high values), with occasional dips to mid-range scores.
- No clear trend, but variability suggests dynamic importance during this phase.
2. **"Thinking" Section (100–14,000 Reasoning Steps)**:
- Lower density of blue lines compared to the "Question" section.
- Importance scores are more dispersed, with many steps near the bottom of the y-axis (low values).
- A notable spike in high-importance steps occurs near the end (12,000–14,000), suggesting a concentrated effort or critical insight.
3. **Red Dashed Line**:
- Positioned at **y = 0.347**, representing the mean importance score.
- The ratio **0.226** likely indicates the proportion of steps exceeding the mean score (22.6%).
---
### Key Observations
- **High Importance in "Question" Phase**: The initial steps (0–100) show a higher concentration of critical reasoning, with most scores near the top of the y-axis.
- **Declining Importance in "Thinking" Phase**: The majority of steps in the "Thinking" phase have low importance scores, with only a small fraction (22.6%) exceeding the mean.
- **Late-Stage Spike**: A sudden increase in high-importance steps near the end of the "Thinking" phase (12,000–14,000) may indicate a breakthrough or final synthesis.
---
### Interpretation
- **Efficiency of Reasoning**: The low mean score (0.347) suggests that most reasoning steps are not highly impactful, potentially indicating inefficiencies in the process.
- **Phase Dynamics**: The "Question" phase is characterized by high-impact steps, while the "Thinking" phase is dominated by lower-impact steps, with a late-stage surge possibly reflecting problem resolution.
- **Ratio Significance**: The ratio of 0.226 implies that only a minority of steps contribute meaningfully, highlighting the need for optimization in the "Thinking" phase to reduce low-value steps.
This chart underscores the disparity in reasoning quality between phases and suggests opportunities to refine the "Thinking" process for greater efficiency.