## Scatter Plot: Compression Ratio vs Performance Score
### Overview
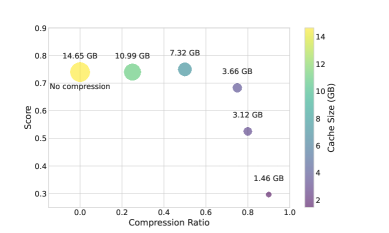
The image is a scatter plot visualizing the relationship between data compression ratio and performance score, with cache size represented through color gradients. The plot shows five distinct data points with explicit labels, positioned across a compression ratio range from 0 to 0.9.
### Components/Axes
- **X-axis**: Compression Ratio (0.0 to 1.0 in 0.1 increments)
- **Y-axis**: Score (0.3 to 0.9 in 0.1 increments)
- **Legend**: Right-aligned color gradient from purple (2 GB) to yellow (14 GB)
- **Data Points**: Five labeled markers with explicit cache sizes and compression ratios
### Detailed Analysis
1. **No Compression (0.0 ratio)**:
- Yellow marker (14.65 GB cache)
- Score: 0.75
- Position: Far left, highest cache size
2. **0.2 Compression Ratio**:
- Green marker (10.99 GB cache)
- Score: 0.72
- Position: Mid-left, second-highest cache
3. **0.5 Compression Ratio**:
- Teal marker (7.32 GB cache)
- Score: 0.68
- Position: Mid-center, moderate cache
4. **0.7 Compression Ratio**:
- Purple marker (3.66 GB cache)
- Score: 0.55
- Position: Mid-right, smaller cache
5. **0.9 Compression Ratio**:
- Dark purple marker (1.46 GB cache)
- Score: 0.30
- Position: Far right, lowest cache
### Key Observations
- **Inverse Relationship**: Score decreases by 0.45 (from 0.75 to 0.30) as compression ratio increases from 0 to 0.9
- **Cache Size Impact**: Larger caches maintain higher scores even with compression (14.65 GB at 0.75 score vs 1.46 GB at 0.30 score)
- **Non-linear Diminishing Returns**: Score drops sharply between 0.7-0.9 compression ratios despite only 0.2 ratio increase
- **Color Consistency**: All markers match legend colors exactly (yellow=14GB, green=10.99GB, teal=7.32GB, purple=3.66GB, dark purple=1.46GB)
### Interpretation
The data demonstrates a clear trade-off between compression efficiency and performance, with cache size acting as a critical moderating factor. Larger caches preserve higher scores even with significant compression, suggesting that cache capacity is essential for maintaining system responsiveness during data processing. The steep decline in performance at higher compression ratios (0.7-0.9) indicates potential algorithmic limitations or data integrity issues at extreme compression levels. The 1.46 GB data point at 0.9 compression ratio represents an outlier in both cache size and performance degradation, possibly indicating a specialized use case or system constraint. This visualization emphasizes the importance of balancing storage efficiency with computational performance in data-intensive applications.