## Chart: HMC Step vs. Value for Different 'd' Values
### Overview
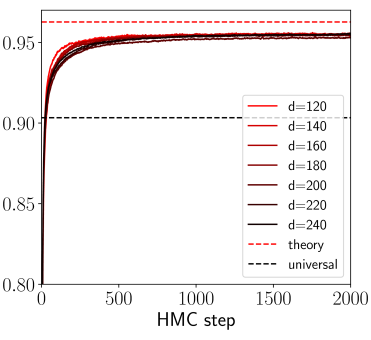
The image is a line chart showing the relationship between the HMC (Hamiltonian Monte Carlo) step and a value that appears to converge over time. Multiple lines represent different values of 'd', and there are two horizontal dashed lines representing "theory" and "universal" values.
### Components/Axes
* **X-axis:** "HMC step", ranging from 0 to 2000.
* **Y-axis:** Value, ranging from 0.80 to 0.95.
* **Legend (Top-Right):**
* `d=120` (Dark Red)
* `d=140` (Red)
* `d=160` (Dark Red)
* `d=180` (Dark Red)
* `d=200` (Dark Brown)
* `d=220` (Dark Brown)
* `d=240` (Black)
* `theory` (Dashed Red)
* `universal` (Dashed Black)
### Detailed Analysis
* **Trend Overview:** All lines representing different 'd' values start at approximately 0.80 and increase rapidly before leveling off.
* **d=120 (Dark Red):** Starts at approximately 0.80, rises sharply, and converges to approximately 0.95.
* **d=140 (Red):** Starts at approximately 0.80, rises sharply, and converges to approximately 0.95.
* **d=160 (Dark Red):** Starts at approximately 0.80, rises sharply, and converges to approximately 0.95.
* **d=180 (Dark Red):** Starts at approximately 0.80, rises sharply, and converges to approximately 0.95.
* **d=200 (Dark Brown):** Starts at approximately 0.80, rises sharply, and converges to approximately 0.95.
* **d=220 (Dark Brown):** Starts at approximately 0.80, rises sharply, and converges to approximately 0.95.
* **d=240 (Black):** Starts at approximately 0.80, rises sharply, and converges to approximately 0.95.
* **theory (Dashed Red):** A horizontal line at approximately 0.97.
* **universal (Dashed Black):** A horizontal line at approximately 0.905.
### Key Observations
* All 'd' values converge to a similar value around 0.95.
* The "theory" line is above all the 'd' value lines.
* The "universal" line is below the converged 'd' value lines.
* The convergence rate appears similar for all 'd' values.
### Interpretation
The chart demonstrates how the value being measured changes with the number of HMC steps for different values of 'd'. The convergence of all 'd' values suggests that the system reaches a stable state regardless of the initial 'd' value. The "theory" line likely represents a theoretical upper bound, while the "universal" line might represent a lower bound or a target value. The fact that the 'd' values converge between these two bounds suggests that the HMC process is effective in reaching a stable and predictable state. The specific meaning of 'd' and the value on the y-axis would require additional context.