## Line Chart: Acceptance Rate vs. HMC Step
### Overview
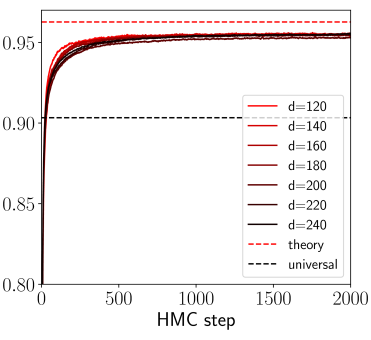
The image presents a line chart illustrating the acceptance rate of Hamiltonian Monte Carlo (HMC) steps as a function of the HMC step number. Multiple lines represent different values of a parameter 'd', alongside theoretical and universal acceptance rate benchmarks.
### Components/Axes
* **X-axis:** "HMC step" - ranging from 0 to 2000.
* **Y-axis:** Acceptance Rate - ranging from 0.80 to 0.96.
* **Legend:** Located in the top-right corner, listing the following lines:
* d = 120 (Red)
* d = 140 (Light Red)
* d = 160 (Medium Red)
* d = 180 (Dark Red)
* d = 200 (Very Dark Red)
* d = 220 (Black)
* d = 240 (Very Dark Black)
* theory (Red Dashed)
* universal (Black Dashed)
### Detailed Analysis
The chart displays several lines representing acceptance rates for different values of 'd'. All lines start at approximately 0.80 at HMC step 0 and increase rapidly initially.
* **d = 120 (Red):** The line starts at approximately 0.80 and rises sharply, reaching around 0.94 at HMC step 200. It then plateaus, fluctuating between 0.94 and 0.95 for the remainder of the chart.
* **d = 140 (Light Red):** Similar to d=120, it starts at 0.80, rises quickly, and reaches approximately 0.945 at HMC step 200, then plateaus around 0.95.
* **d = 160 (Medium Red):** Starts at 0.80, rises quickly, and reaches approximately 0.95 at HMC step 200, then plateaus around 0.95.
* **d = 180 (Dark Red):** Starts at 0.80, rises quickly, and reaches approximately 0.95 at HMC step 200, then plateaus around 0.95.
* **d = 200 (Very Dark Red):** Starts at 0.80, rises quickly, and reaches approximately 0.95 at HMC step 200, then plateaus around 0.95.
* **d = 220 (Black):** Starts at 0.80, rises quickly, and reaches approximately 0.95 at HMC step 200, then plateaus around 0.95.
* **d = 240 (Very Dark Black):** Starts at 0.80, rises quickly, and reaches approximately 0.95 at HMC step 200, then plateaus around 0.95.
* **theory (Red Dashed):** A horizontal line at approximately 0.955.
* **universal (Black Dashed):** A horizontal line at approximately 0.90.
All lines for different 'd' values converge to a similar plateau around 0.95 after approximately 200 HMC steps.
### Key Observations
* The acceptance rates for all 'd' values converge to a similar value as the number of HMC steps increases.
* The 'theory' line represents a higher acceptance rate than the observed values.
* The 'universal' line represents a lower acceptance rate than the observed values.
* The initial rise in acceptance rate is rapid for all 'd' values.
### Interpretation
The chart demonstrates the convergence of the acceptance rate of HMC as the number of steps increases. The convergence suggests that the algorithm is effectively exploring the parameter space. The observed acceptance rates are generally higher than the 'universal' benchmark and lower than the 'theory' benchmark. This discrepancy could indicate that the theoretical model used to derive the 'theory' line is an overestimation, or that the HMC implementation is not perfectly optimized. The convergence of the lines for different 'd' values suggests that the parameter 'd' has a diminishing effect on the acceptance rate as the number of HMC steps increases. The rapid initial increase in acceptance rate likely reflects the algorithm quickly adapting to the target distribution. The plateau indicates that the algorithm has reached a stable state where the acceptance rate is balanced between exploring new regions of the parameter space and accepting existing samples.