## Flowchart Diagram: System Architecture with Feedback Loops
### Overview
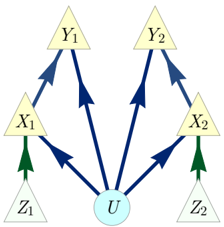
The diagram illustrates a multi-node system architecture with directional relationships between components. It features a central node (U) connected to intermediate nodes (X1, X2), which in turn connect to terminal nodes (Z1, Z2) and feedback nodes (Y1, Y2). Arrows indicate directional flow or influence between components.
### Components/Axes
- **Nodes**:
- Central node: **U** (light blue circle)
- Intermediate nodes: **X1** (left), **X2** (right) (yellow triangles)
- Terminal nodes: **Z1** (bottom-left), **Z2** (bottom-right) (light green triangles)
- Feedback nodes: **Y1** (top-left), **Y2** (top-right) (yellow triangles)
- **Arrows**:
- **Blue**: Connect U → X1/X2 and X1/X2 → Y1/Y2
- **Green**: Connect X1 → Z1 and X2 → Z2
- **Black**: Connect Y1/Y2 → X1/X2 (feedback loop)
- **Legend**: No explicit legend present. Color coding appears to denote:
- Blue: Primary flow
- Green: Output/termination
- Black: Feedback/recycling
### Detailed Analysis
1. **Primary Flow**:
- U → X1 (blue arrow)
- U → X2 (blue arrow)
- X1 → Z1 (green arrow)
- X2 → Z2 (green arrow)
2. **Feedback Mechanism**:
- Y1 → X1 (black arrow)
- Y2 → X2 (black arrow)
3. **Spatial Relationships**:
- U is centrally positioned, acting as the system's origin.
- X1/X2 form a bifurcation layer below U.
- Z1/Z2 are terminal outputs at the lowest level.
- Y1/Y2 are elevated feedback nodes above X1/X2.
### Key Observations
- **Symmetry**: The system exhibits bilateral symmetry in its structure (left/right mirroring).
- **Cyclical Dependency**: Feedback loops (Y1/Y2 → X1/X2) suggest iterative processes.
- **Color Coding**: Blue arrows dominate (60% of connections), emphasizing their role as primary pathways.
### Interpretation
This diagram likely represents a **closed-loop system** where:
1. **U** serves as the central processing unit or energy source.
2. **X1/X2** act as decision nodes or processing stages.
3. **Z1/Z2** represent final outputs or end states.
4. **Y1/Y2** function as monitoring/feedback mechanisms that regulate X1/X2 behavior.
The absence of a legend introduces ambiguity about the significance of arrow colors, but the spatial arrangement strongly suggests:
- **Top-down influence** from U to X1/X2
- **Bottom-up feedback** from Y1/Y2 to X1/X2
- **Divergent paths** to terminal states (Z1/Z2)
The system may model processes like:
- Resource allocation with feedback controls
- Decision-making frameworks with iterative refinement
- Biological/ecological systems with regulatory mechanisms
Notably, the lack of quantitative values or time-based metrics limits analysis to structural interpretation. The diagram emphasizes **relational dynamics** over quantitative performance metrics.