## Line Charts: RM Provided vs RM Learnt vs Without RM
### Overview
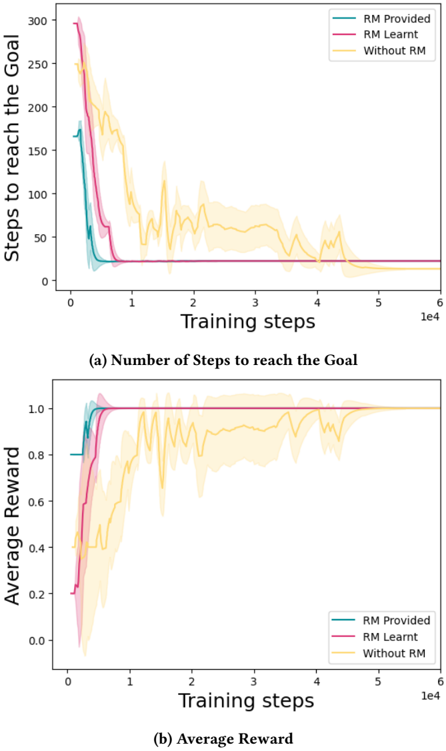
The image contains two line charts comparing the performance of three different reinforcement learning approaches: "RM Provided", "RM Learnt", and "Without RM". The first chart shows the number of steps to reach the goal as a function of training steps, while the second chart shows the average reward as a function of training steps. Both charts display the data from 0 to 60,000 training steps. Each line is surrounded by a shaded region, representing the variance or uncertainty in the data.
### Components/Axes
**Chart 1: Number of Steps to reach the Goal**
* **Y-axis:** "Steps to reach the Goal", ranging from 0 to 300.
* **X-axis:** "Training steps", ranging from 0 to 6 x 10^4 (60,000).
* **Title:** "(a) Number of Steps to reach the Goal"
* **Legend:** Located in the top-right corner.
* "RM Provided" - Teal line
* "RM Learnt" - Pink/Magenta line
* "Without RM" - Yellow line
**Chart 2: Average Reward**
* **Y-axis:** "Average Reward", ranging from 0.0 to 1.0.
* **X-axis:** "Training steps", ranging from 0 to 6 x 10^4 (60,000).
* **Title:** "(b) Average Reward"
* **Legend:** Located in the bottom-right corner.
* "RM Provided" - Teal line
* "RM Learnt" - Pink/Magenta line
* "Without RM" - Yellow line
### Detailed Analysis
**Chart 1: Number of Steps to reach the Goal**
* **RM Provided (Teal):** Starts at approximately 175 steps, rapidly decreases to around 25 steps by 10,000 training steps, and then remains relatively constant around 20-25 steps.
* **RM Learnt (Pink/Magenta):** Starts at approximately 300 steps, decreases to around 25 steps by 10,000 training steps, and then remains relatively constant around 20-25 steps.
* **Without RM (Yellow):** Starts at approximately 250 steps, decreases to around 50 steps by 20,000 training steps, and then fluctuates between 25 and 75 steps, eventually stabilizing around 25 steps after 50,000 training steps.
**Chart 2: Average Reward**
* **RM Provided (Teal):** Starts at approximately 0.8, rapidly increases to 1.0 by 10,000 training steps, and then remains constant at 1.0.
* **RM Learnt (Pink/Magenta):** Starts at approximately 0.2, rapidly increases to 1.0 by 10,000 training steps, and then remains constant at 1.0.
* **Without RM (Yellow):** Starts at approximately 0.2, gradually increases to approximately 0.9 by 40,000 training steps, with significant fluctuations along the way, and then stabilizes around 1.0 after 50,000 training steps.
### Key Observations
* Both "RM Provided" and "RM Learnt" approaches converge to a low number of steps and a high average reward much faster than the "Without RM" approach.
* "RM Learnt" starts with the worst performance in terms of average reward, but quickly catches up to "RM Provided".
* The "Without RM" approach exhibits more variability in both the number of steps and the average reward, especially in the early stages of training.
### Interpretation
The data suggests that providing or learning a reward model (RM) significantly improves the performance of the reinforcement learning agent, leading to faster convergence and better overall results. The "RM Provided" and "RM Learnt" approaches are more efficient in terms of training steps required to achieve optimal performance compared to the "Without RM" approach. The fluctuations in the "Without RM" approach indicate that the agent struggles to learn a consistent policy without the guidance of a reward model. The rapid improvement of "RM Learnt" suggests that the agent can effectively learn a useful reward model from the environment.