## Line Charts: Performance Comparison of Reinforcement Learning Models
### Overview
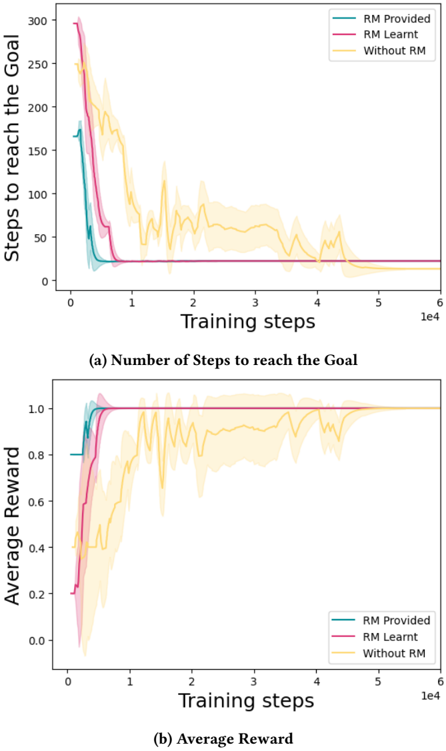
This image displays two line charts illustrating the training performance of three different reinforcement learning configurations: "RM Provided," "RM Learnt," and "Without RM." The top chart (a) tracks the "Number of Steps to reach the Goal," while the bottom chart (b) tracks the "Average Reward." Both charts plot these metrics against "Training steps" on the x-axis, scaled by $1e4$ (10,000). Shaded regions around each line represent the variance or uncertainty of the data.
### Components/Axes
**Common Elements:**
* **X-Axis:** Labeled "Training steps" for both charts. The scale ranges from 0 to $6 \times 10^4$ (60,000 steps).
* **Legend:**
* **Teal Line:** "RM Provided"
* **Magenta/Purple Line:** "RM Learnt"
* **Yellow/Orange Line:** "Without RM"
* **Spatial Positioning:**
* **Chart (a) Legend:** Located in the top-right corner.
* **Chart (b) Legend:** Located in the bottom-right corner.
**Chart (a) - Number of Steps to reach the Goal:**
* **Y-Axis:** Labeled "Steps to reach the Goal." Scale ranges from 0 to 300.
**Chart (b) - Average Reward:**
* **Y-Axis:** Labeled "Average Reward." Scale ranges from 0.0 to 1.0.
---
### Detailed Analysis
#### Chart (a): Number of Steps to reach the Goal
* **Trend Verification:** All three models show a downward trend, indicating that as training progresses, the number of steps required to reach the goal decreases.
* **RM Provided (Teal):** Starts at approximately 160 steps. It drops sharply and stabilizes at roughly 20 steps by $0.5 \times 10^4$ training steps. The shaded variance is narrow, indicating high stability.
* **RM Learnt (Magenta):** Starts at approximately 300 steps. It shows a steep downward trend, reaching the stable baseline of ~20 steps by approximately $0.8 \times 10^4$ training steps.
* **Without RM (Yellow):** Starts at approximately 250 steps. It exhibits high volatility (wide shaded region) and a much slower, erratic downward trend. It does not reach the stable baseline of ~20 steps until approximately $4.5 \times 10^4$ training steps.
#### Chart (b): Average Reward
* **Trend Verification:** All three models show an upward trend, indicating that as training progresses, the average reward increases toward a maximum of 1.0.
* **RM Provided (Teal):** Starts at an average reward of 0.8. It rises quickly to 1.0 by $0.5 \times 10^4$ training steps and remains stable.
* **RM Learnt (Magenta):** Starts at an average reward of 0.2. It rises steadily, reaching 1.0 by approximately $0.8 \times 10^4$ training steps.
* **Without RM (Yellow):** Starts at an average reward of 0.4. It shows significant fluctuation and a slow, inconsistent rise. It only converges to a stable reward of 1.0 around $4.5 \times 10^4$ training steps.
---
### Key Observations
* **Efficiency Gap:** The "RM Provided" model is the most efficient, followed closely by "RM Learnt." Both significantly outperform the "Without RM" configuration.
* **Convergence Speed:** The "Without RM" model takes roughly 5 to 9 times longer to reach the same performance level (convergence) as the models utilizing a Reward Model (RM).
* **Stability:** The "Without RM" model exhibits high variance throughout the training process, as evidenced by the wide, jagged shaded region, suggesting that training without a reward model is unstable and unpredictable.
---
### Interpretation
The data strongly suggests that the inclusion of a Reward Model (RM)—whether provided explicitly or learned—is critical for efficient and stable reinforcement learning in this environment.
* **The Role of RM:** The Reward Model acts as a dense signal that guides the agent toward the goal. Without it, the agent likely relies on sparse rewards, leading to the observed "random walk" behavior and high variance in the "Without RM" plots.
* **RM Learnt vs. Provided:** The "RM Learnt" model performs nearly as well as the "RM Provided" model, suggesting that the system is capable of effectively learning its own reward function without needing it to be hard-coded, albeit with a slight delay in convergence.
* **Practical Implication:** In scenarios where defining a reward function is difficult, these results demonstrate that learning a reward model is a viable and highly effective strategy to achieve performance comparable to having a provided reward model, while avoiding the instability of training without one.